Newport Beach market update · September 2026
Updated October 22, 2026
Your monthly look at the Newport Beach real estate market.
Stay informed about local home prices, market trends, and recent sales—whether you’re considering a move or simply keeping track of your home’s value.
See What My Home Could Sell For →Get a personalized review using recent sales of homes like yours.
Explore recent sales ↓Market balance
Newport Beach: seller’s market.
Source: RPR · Single Family · September 2026.
Your monthly market overview
Newport Beach Market Update – September 2026
🏡 Newport Beach headed into fall with fewer months of supply. The single-family figures show that conditions favored sellers, but your neighborhood and the homes competing with yours still deserve a closer look.
📉 Supply tightened to 3.82 months, down 11.8% from August. That’s limited supply, but it doesn’t mean every listing will sell quickly or at any price.
💰 The median sold price was $4,400,000, up 13.6% from August. The mix of homes sold can shift that figure, so it doesn’t mean every home’s value changed by the same amount.
⏱️ Homes that sold spent a median of 40 days on the market, up 42.9% from August. Sales came in at 96.79% of asking price overall.
💵 The median estimated home value was $4,109,680, up 0.7% for the month and up 5.4% over the past year. Think of it as a broader value estimate, separate from this month’s sale prices.
Bottom line: Limited supply can help sellers, but a thoughtful asking price still matters. Your closest comparable sales are a better guide than the city median alone. You’re welcome to ask for a home-value review even if you’re staying put.
The bigger picture
One month is a snapshot. Five years adds perspective.
A longer look at single-family prices and available supply in Newport Beach.
Median sold price
September’s median was $4,400,000. The mix of homes sold can move the median; nearby comparable sales are a better guide to your home.
Months of inventory
September had 3.82 months of supply. Tighter supply gives buyers fewer homes to choose from.
Source: RPR · Single Family · Retrieved October 22, 2026. Chart scales differ by city and metric.
Your property type matters
Single-family and condo markets, side by side.
A single-family headline will not tell every owner the same story. Compare the price, available supply, and selling time for your property type.
Time to sell, side by side
Single Family 40 daysCondo / Townhouse / Apt. 86 daysWhat actually sold
Find recent sales closer to your price range.
Browse 72 September CRMLS sales by property type, price, and closing date. Open a card’s property link for the matching OneHome listing and full details.
Price ranges use this report’s sales sample, with quartiles rounded to $50,000.
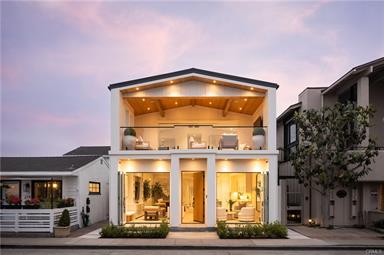
221 Abalone
Newport Beach · 4 beds · 5 baths · 2,972 sq ft
CRMLS · OC26198010View photos & property details ↗
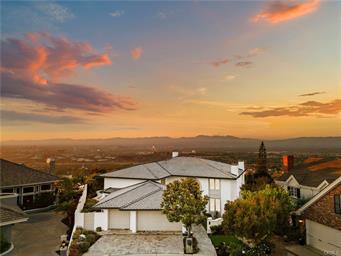
17 Napoli
Newport Beach · 5 beds · 8 baths · 7,844 sq ft
CRMLS · OC26113605View photos & property details ↗
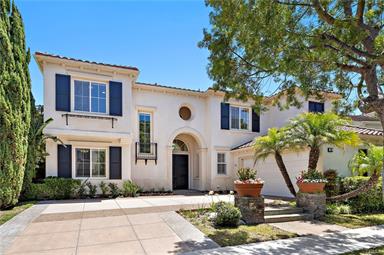
16 Regents
Newport Beach · 5 beds · 4 baths · 3,153 sq ft
CRMLS · NP26163563View photos & property details ↗
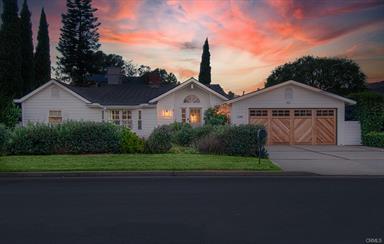
2285 Tustin AVE
Newport Beach · 4 beds · 3 baths · 2,707 sq ft
CRMLS · LG26180127View photos & property details ↗
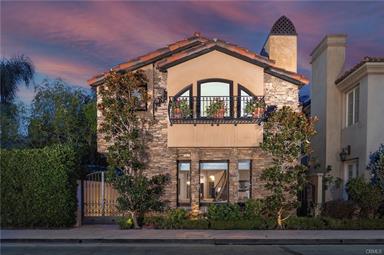
111 Via Koron
Newport Beach · 3 beds · 4 baths · 2,675 sq ft
CRMLS · OC26050055View photos & property details ↗
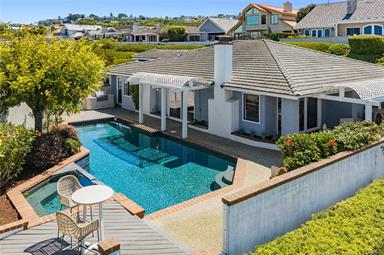
2001 Yacht Mischief
Newport Beach · 3 beds · 2 baths · 2,012 sq ft
CRMLS · NP26173869View photos & property details ↗
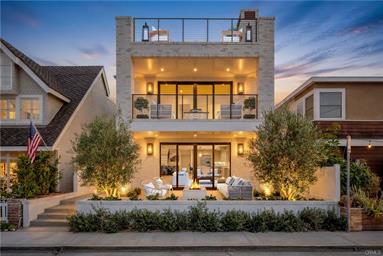
225 Diamond
Newport Beach · 4 beds · 5 baths · 2,312 sq ft
CRMLS · NP26170033View photos & property details ↗
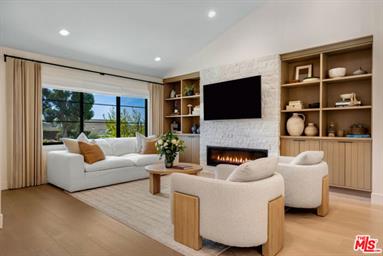
912 Aleppo ST
Newport Beach · 4 beds · 3 baths · 2,666 sq ft
CRMLS · 26876295View photos & property details ↗
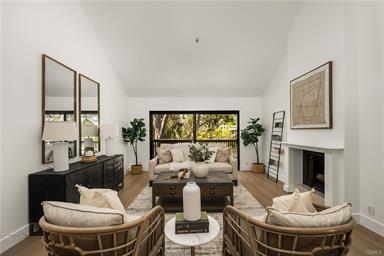
9 Canyon Island DR
Newport Beach · 2 beds · 2 baths · 1,197 sq ft
CRMLS · PW26114601View photos & property details ↗
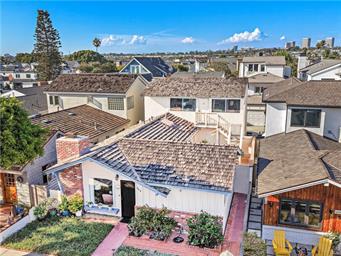
2012 E Ocean BLVD
Newport Beach · 4 beds · 3 baths · 1,643 sq ft
CRMLS · OC26186519View photos & property details ↗
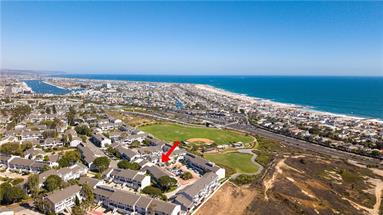
10 Ima Loa CT
Newport Beach · 2 beds · 3 baths · 1,170 sq ft
CRMLS · OC26144927View photos & property details ↗
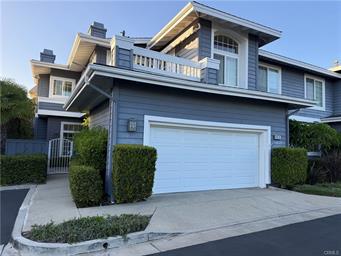
950 Poppy LN
Newport Beach · 2 beds · 2 baths · 1,425 sq ft
CRMLS · NP26205812View photos & property details ↗
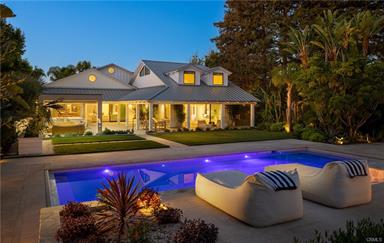
2419 Santiago
Newport Beach · 5 beds · 5 baths · 4,804 sq ft
CRMLS · NP26157680View photos & property details ↗
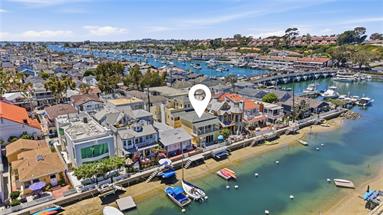
325 Grand Canal
Newport Beach · 4 beds · 4 baths · 2,542 sq ft
CRMLS · NP26146159View photos & property details ↗
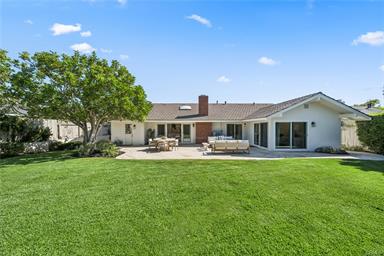
926 Bellis ST
Newport Beach · 4 beds · 3 baths · 2,123 sq ft
CRMLS · NP26133202View photos & property details ↗
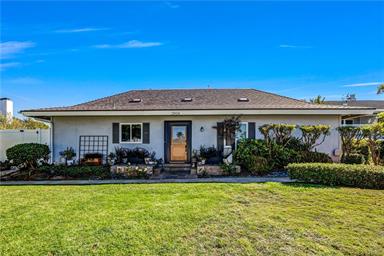
2504 University
Newport Beach · 2 beds · 2 baths · 1,678 sq ft
CRMLS · OC26163191View photos & property details ↗
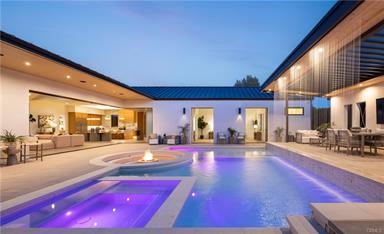
1453 Galaxy Dr
Newport Beach · 5 beds · 8 baths · 5,755 sq ft
CRMLS · OC26092181View photos & property details ↗
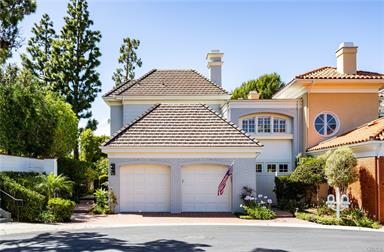
2 Chatham CT
Newport Beach · 3 beds · 4 baths · 4,387 sq ft
CRMLS · OC26090994View photos & property details ↗
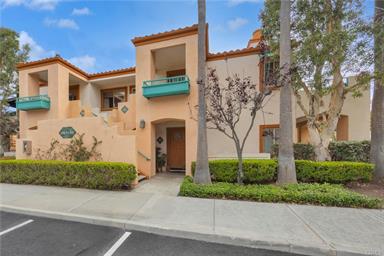
290 Villa Point DR
Newport Beach · 1 beds · 1 baths · 774 sq ft
CRMLS · OC26146032View photos & property details ↗
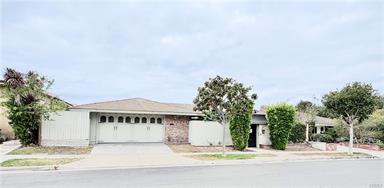
2507 Island View
Newport Beach · 4 beds · 3 baths · 2,629 sq ft
CRMLS · NP26206072View photos & property details ↗
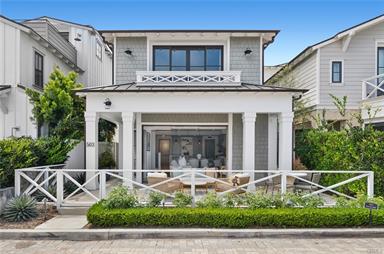
503 L ST
Newport Beach · 4 beds · 5 baths · 3,148 sq ft
CRMLS · NP26105485View photos & property details ↗
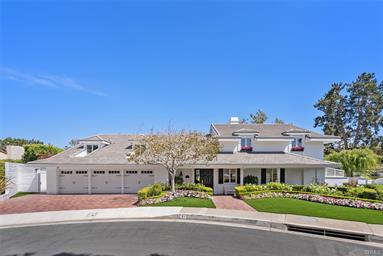
21 Lochmoor
Newport Beach · 5 beds · 8 baths · 6,293 sq ft
CRMLS · OC26033636View photos & property details ↗
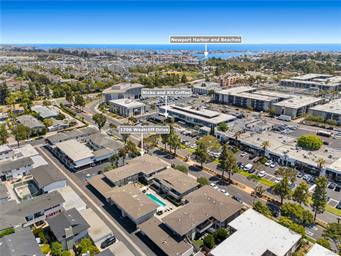
1706 Westcliff
Newport Beach · 2 beds · 1 baths · 929 sq ft
CRMLS · NP26167584View photos & property details ↗
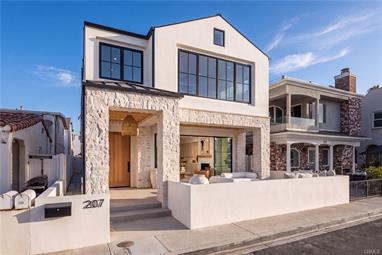
207 43rd Street
Newport Beach · 4 beds · 6 baths · 3,130 sq ft
CRMLS · NP26156704View photos & property details ↗
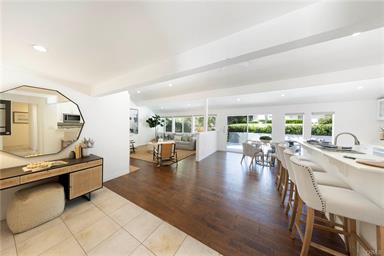
2102 Vista Entrada
Newport Beach · 3 beds · 2 baths · 1,655 sq ft
CRMLS · NP26091602View photos & property details ↗
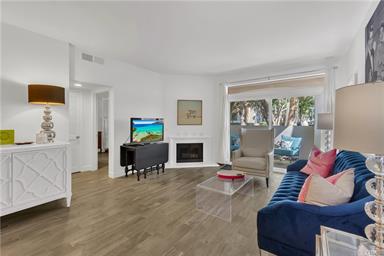
358 Villa Point
Newport Beach · 1 beds · 1 baths · 792 sq ft
CRMLS · NP26079709View photos & property details ↗
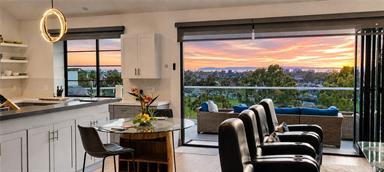
17 Monaco #12
Newport Beach · 3 beds · 3 baths · 3,501 sq ft
CRMLS · NP25147448View photos & property details ↗
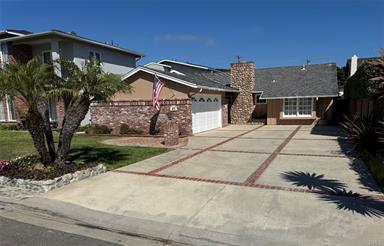
416 Aliso AVE
Newport Beach · 3 beds · 2 baths · 1,830 sq ft
CRMLS · OC26115257View photos & property details ↗
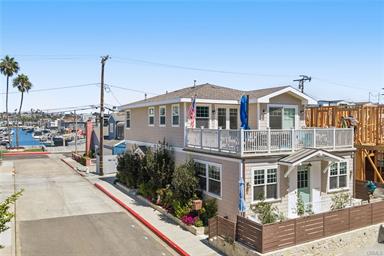
3618 Park LN
Newport Beach · 4 beds · 3 baths · 1,913 sq ft
CRMLS · NP26188912View photos & property details ↗
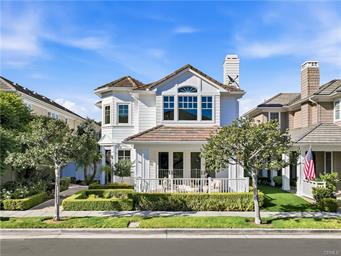
30 Long Bay
Newport Beach · 4 beds · 4 baths · 3,100 sq ft
CRMLS · NP26155112View photos & property details ↗
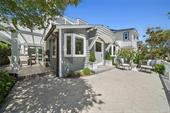
1730 E Ocean BLVD
Newport Beach · 3 beds · 3 baths · 2,100 sq ft
CRMLS · NP26099570View photos & property details ↗
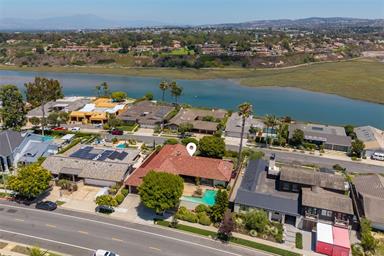
1842 Santiago
Newport Beach · 4 beds · 3 baths · 2,500 sq ft
CRMLS · OC26182017View photos & property details ↗
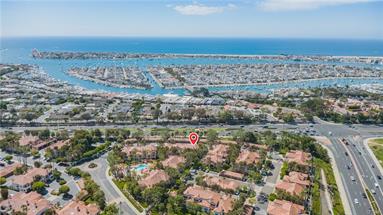
46 Villa Point
Newport Beach · 2 beds · 2 baths · 1,410 sq ft
CRMLS · OC26077462View photos & property details ↗
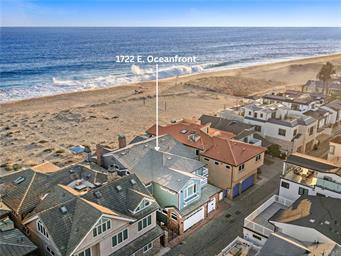
1722 E Oceanfront
Newport Beach · 5 beds · 7 baths · 3,962 sq ft
CRMLS · OC26202912View photos & property details ↗
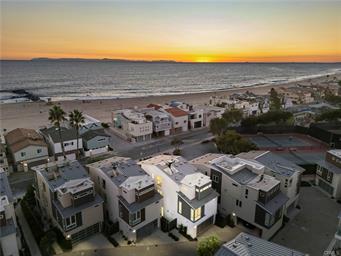
5512 Seashore
Newport Beach · 3 beds · 3 baths · 2,326 sq ft
CRMLS · OC25278464View photos & property details ↗
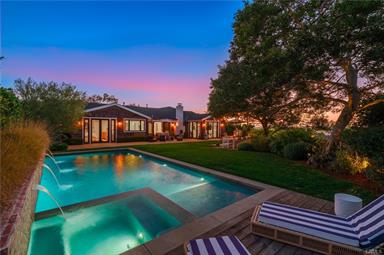
2930 Alta Vista
Newport Beach · 5 beds · 4 baths · 2,832 sq ft
CRMLS · NP26202162View photos & property details ↗
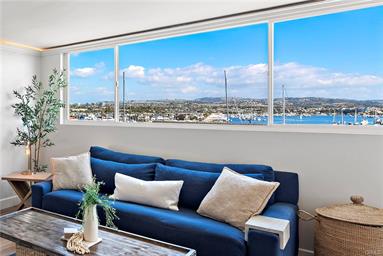
310 Fernando ST #303
Newport Beach · 1 beds · 2 baths · 962 sq ft
CRMLS · NP26052640View photos & property details ↗
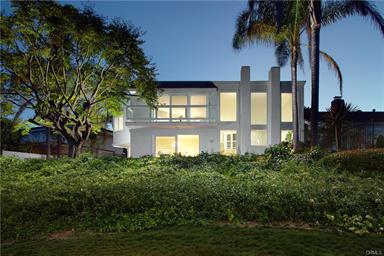
10 Rue Grand Ducal
Newport Beach · 3 beds · 4 baths · 3,853 sq ft
CRMLS · NP26080275View photos & property details ↗
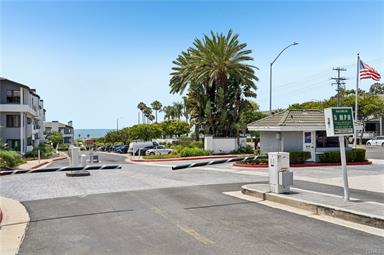
240 Nice LN #117
Newport Beach · 1 beds · 1 baths · 915 sq ft
CRMLS · OC26170092View photos & property details ↗
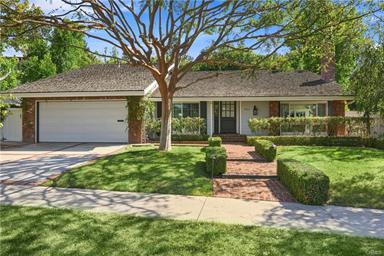
1844 Newport Hills E
Newport Beach · 3 beds · 2 baths · 1,714 sq ft
CRMLS · NP26160201View photos & property details ↗
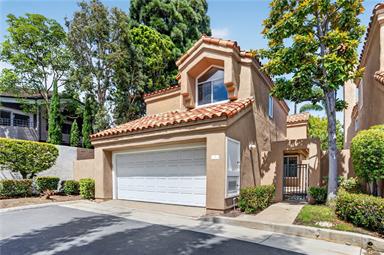
1 Cormorant Circle
Newport Beach · 3 beds · 3 baths · 1,739 sq ft
CRMLS · NP26144045View photos & property details ↗
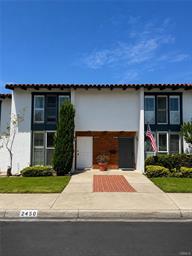
2450 Vista Hogar
Newport Beach · 3 beds · 2 baths · 1,260 sq ft
CRMLS · IG26086623View photos & property details ↗
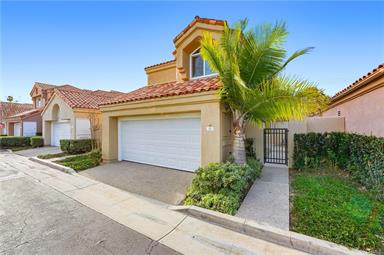
63 Shearwater
Newport Beach · 3 beds · 3 baths · 1,739 sq ft
CRMLS · PW26020448View photos & property details ↗
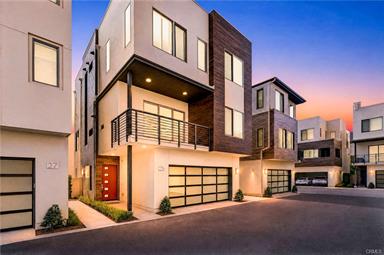
25 Ebb Tide
Newport Beach · 3 beds · 4 baths · 2,229 sq ft
CRMLS · OC26132938View photos & property details ↗
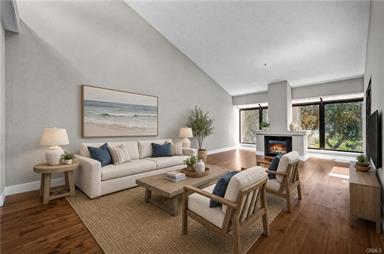
200 Paris LN #304
Newport Beach · 1 beds · 1 baths · 975 sq ft
CRMLS · NP26158593View photos & property details ↗
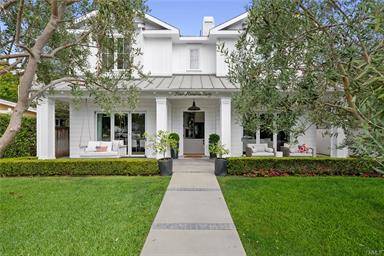
460 Santa Ana AVE
Newport Beach · 4 beds · 5 baths · 4,961 sq ft
CRMLS · NP26153724View photos & property details ↗
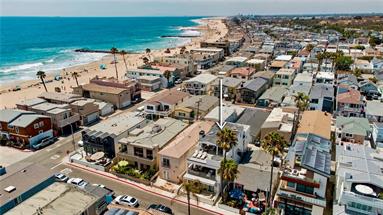
115 41st ST
Newport Beach · 5 beds · 6 baths · 2,900 sq ft
CRMLS · NP26150062View photos & property details ↗
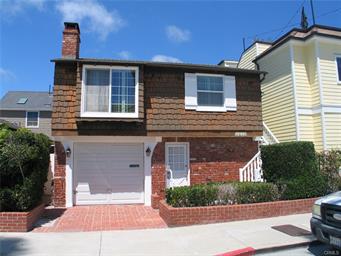
1610 Park AVE
Newport Beach · 3 beds · 2 baths · 1,008 sq ft
CRMLS · NP26071113View photos & property details ↗
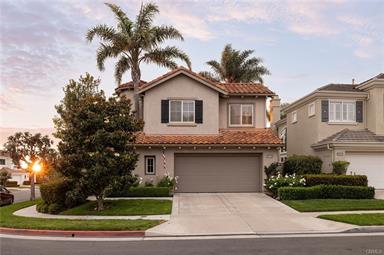
1415 Sea Ridge Drive
Newport Beach · 3 beds · 3 baths · 2,460 sq ft
CRMLS · NP26050370View photos & property details ↗
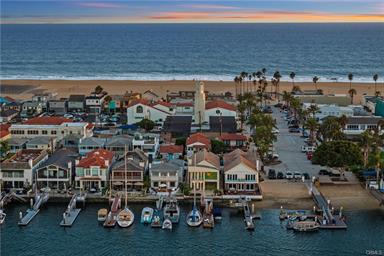
1440 W Bay AVE
Newport Beach · 4 beds · 3 baths · 3,264 sq ft
CRMLS · OC26196767View photos & property details ↗
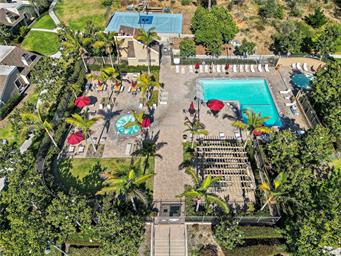
7 Big Dipper CT
Newport Beach · 2 beds · 3 baths · 1,157 sq ft
CRMLS · OC26098964View photos & property details ↗
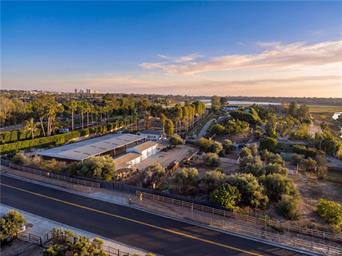
2100 Mesa
Newport Beach · 1 beds · 2 baths · 2,000 sq ft
CRMLS · NP26198662View photos & property details ↗
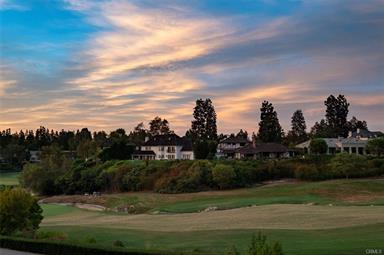
18 Rue Grand Vallee
Newport Beach · 4 beds · 4 baths · 3,264 sq ft
CRMLS · NP26178611View photos & property details ↗
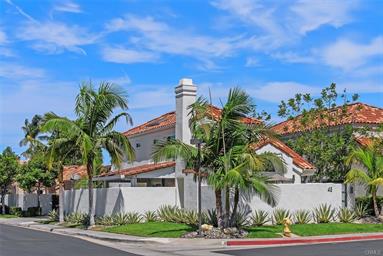
43 Gannet LN
Newport Beach · 3 beds · 3 baths · 1,606 sq ft
CRMLS · NP26155800View photos & property details ↗
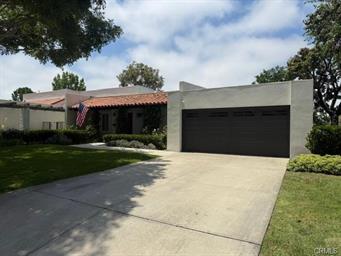
2015 Barranca
Newport Beach · 3 beds · 2 baths · 1,184 sq ft
CRMLS · NP26128531View photos & property details ↗
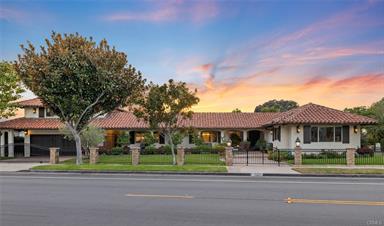
1511 Santiago DR
Newport Beach · 5 beds · 6 baths · 4,403 sq ft
CRMLS · NP26108030View photos & property details ↗
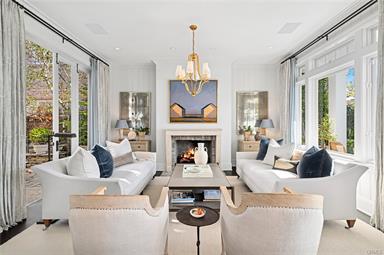
2601 Bayshore DR
Newport Beach · 4 beds · 5 baths · 3,672 sq ft
CRMLS · NP26015410View photos & property details ↗
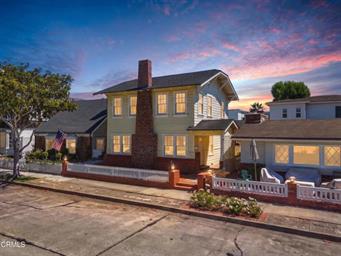
1713 Miramar DR
Newport Beach · 3 beds · 2 baths · 1,152 sq ft
CRMLS · P1-28193View photos & property details ↗
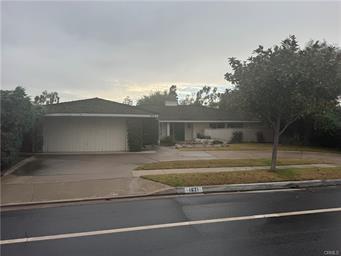
1621 Santiago DR
Newport Beach · 5 beds · 3 baths · 3,029 sq ft
CRMLS · NP26195541View photos & property details ↗
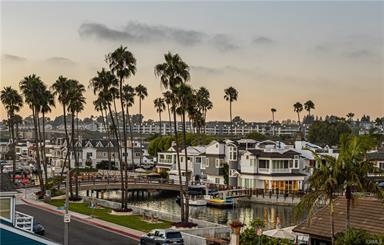
3601 Lake Avenue
Newport Beach · 4 beds · 5 baths · 2,200 sq ft
CRMLS · NP26180731View photos & property details ↗
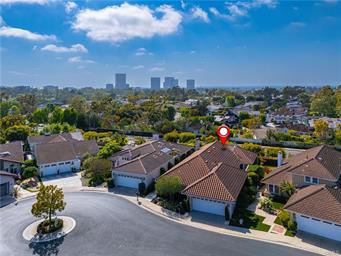
1907 Yacht Maria
Newport Beach · 3 beds · 3 baths · 2,482 sq ft
CRMLS · NP26107575View photos & property details ↗
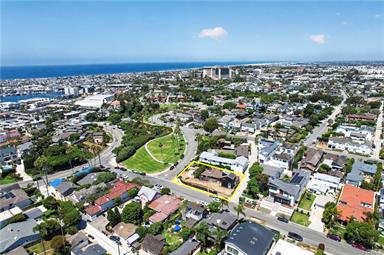
2700 Cliff
Newport Beach · 2 beds · 2 baths · 2,369 sq ft
CRMLS · LG26131547View photos & property details ↗
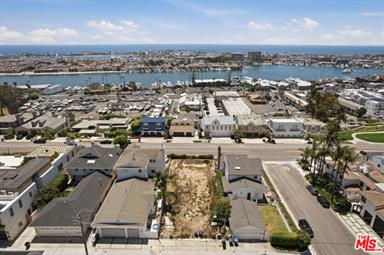
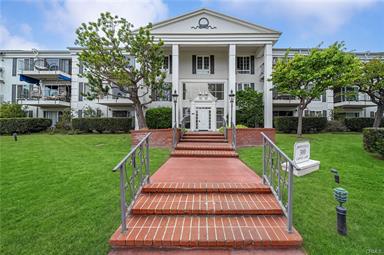
300 Cagney PH5
Newport Beach · 1 beds · 1 baths · 561 sq ft
CRMLS · RS26134285View photos & property details ↗
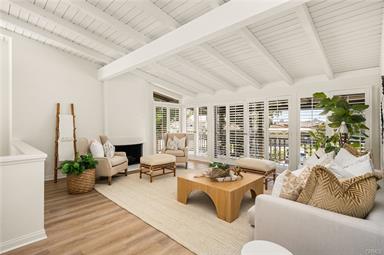
2108 Vista Entrada
Newport Beach · 4 beds · 3 baths · 2,053 sq ft
CRMLS · PW26104975View photos & property details ↗
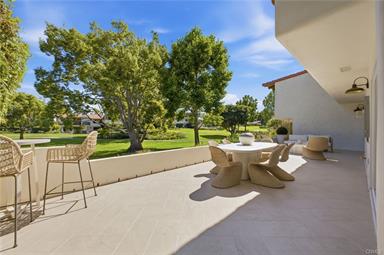
539 Vista Flora
Newport Beach · 3 beds · 3 baths · 1,737 sq ft
CRMLS · OC26131822View photos & property details ↗
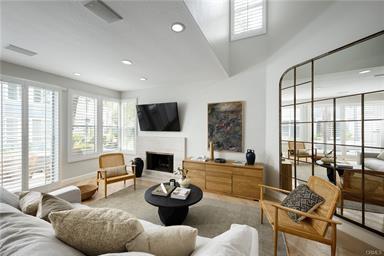
206 Hartford
Newport Beach · 3 beds · 3 baths · 1,741 sq ft
CRMLS · OC26152944View photos & property details ↗
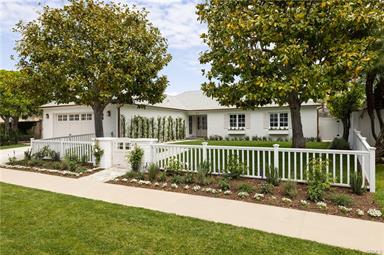
1112 Pembroke LN
Newport Beach · 4 beds · 4 baths · 2,700 sq ft
CRMLS · OC26121456View photos & property details ↗
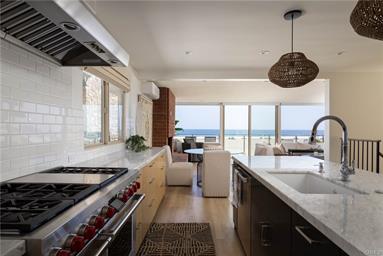
6704 W Oceanfront
Newport Beach · 4 beds · 5 baths · 2,640 sq ft
CRMLS · NP26114513View photos & property details ↗
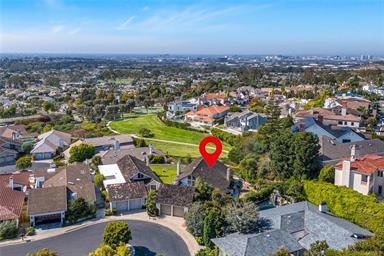
2127 Yacht Julia
Newport Beach · 4 beds · 3 baths · 3,049 sq ft
CRMLS · OC26171411View photos & property details ↗
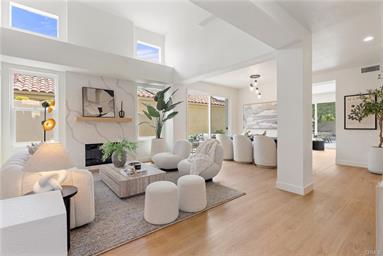
67 Pelican CT
Newport Beach · 3 beds · 3 baths · 2,105 sq ft
CRMLS · OC26107033View photos & property details ↗
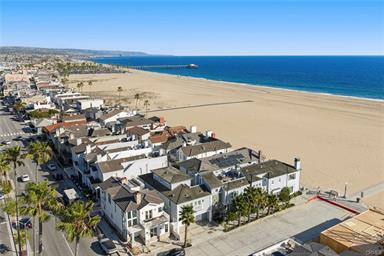
524 W Oceanfront
Newport Beach · 11 beds · 12 baths · 6,249 sq ft
CRMLS · OC26079639View photos & property details ↗
Source: CRMLS Matrix, closed September 1–30, 2026; Single Family Residence, Condominium, and Townhouse. This is a separate dataset from RPR. Photos are from the listing record. Model photos, floor plans, and edited images are labelled when identified. Open OneHome for full property details.
Around Newport Beach
Local news and developments.
September 3, 2026 filing notice
Park Newport application remains under review
The City’s case record for 1 Park Newport Drive describes two proposed apartment buildings with 366 homes and 41 accessory dwelling units. A September 3 notice identified an incomplete filing. This is an application under review, rather than an approved or completed addition to housing supply.
Read the local update ↗September 8, 2026 construction update
Bay Bridge sewer work continues
OC San reports that tunneling beneath the bay is complete and crews are installing two force mains for the Bay Bridge pump-station project. Work affects the Coast Highway area near Dover Drive. Finishing the tunnel does not mean the entire sewer project is complete.
Read the local update ↗Local updates checked October 22, 2026. Each item shows its original action date or planning context.
From city trends to your home
Want a closer look at your home’s value?
I will look at the nearby sales, competing listings, and details that make your property different. You will get a clearer starting point for your next decision.
No pressure to list. Just a useful conversation.Prefer to talk? (949) 534-6686
Sources, methodology, and data notes
Headline statistics and charts: RPR Market Trends for Newport Beach, September 2026, Single Family. RPR public-record sales are not combined with listing sales. Recent properties: CRMLS, closed September 1–30, 2026, Single Family Residence, Condominium, and Townhouse. Listing-city labels do not certify municipal boundaries. A city median does not establish a particular home’s value.
Explore other local market reports · Request a personal home-value review