Huntington Beach market update · September 2026
Updated October 22, 2026
Your monthly look at the Huntington Beach real estate market.
Stay informed about local home prices, market trends, and recent sales—whether you’re considering a move or simply keeping track of your home’s value.
See What My Home Could Sell For →Get a personalized review using recent sales of homes like yours.
Explore recent sales ↓Market balance
Huntington Beach: seller’s market.
Source: RPR · Single Family · September 2026.
Your monthly market overview
Huntington Beach Market Update – September 2026
🏡 September brought tighter supply to Huntington Beach’s single-family market. Overall, conditions favored sellers. Here’s what that could mean if you’re watching your home’s value or thinking about a move.
📉 Supply tightened to 2.03 months, down 8.1% from August. That’s limited supply, but it doesn’t mean every listing will sell quickly or at any price.
💰 The median sold price was $1,675,000, up 2.1% from August. The mix of homes sold can shift that figure, so it doesn’t mean every home’s value changed by the same amount.
⏱️ Homes that sold spent a median of 27 days on the market, up 107.7% from August. Sales came in at 98.92% of asking price overall.
💵 The median estimated home value was $1,525,970, up 1.2% for the month and up 2.6% over the past year. Think of it as a broader value estimate, separate from this month’s sale prices.
Bottom line: Limited supply can help sellers, but a thoughtful asking price still matters. Your closest comparable sales are a better guide than the city median alone. You’re welcome to ask for a home-value review even if you’re staying put.
The bigger picture
One month is a snapshot. Five years adds perspective.
A longer look at single-family prices and available supply in Huntington Beach.
Median sold price
September’s median was $1,675,000. The mix of homes sold can move the median; nearby comparable sales are a better guide to your home.
Months of inventory
September had 2.03 months of supply. Tighter supply gives buyers fewer homes to choose from.
Source: RPR · Single Family · Retrieved October 22, 2026. Chart scales differ by city and metric.
Your property type matters
Single-family and condo markets, side by side.
A single-family headline will not tell every owner the same story. Compare the price, available supply, and selling time for your property type.
Time to sell, side by side
Single Family 27 daysCondo / Townhouse / Apt. 40 daysWhat actually sold
Find recent sales closer to your price range.
Browse 146 September CRMLS sales by property type, price, and closing date. Open a card’s property link for the matching OneHome listing and full details.
Price ranges use this report’s sales sample, with quartiles rounded to $50,000.
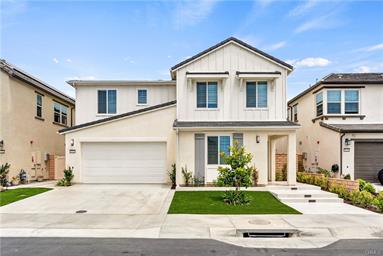
21212 Altair LN
Huntington Beach · 5 beds · 5 baths · 3,247 sq ft
CRMLS · TR26164446View photos & property details ↗
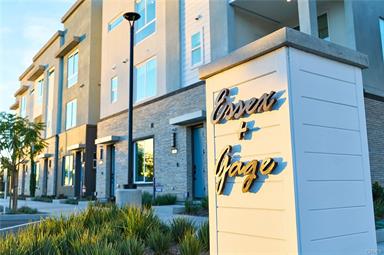
7266 Pointbreak DR
Huntington Beach · 3 beds · 3 baths · 1,500 sq ft
CRMLS · OC26187874View photos & property details ↗
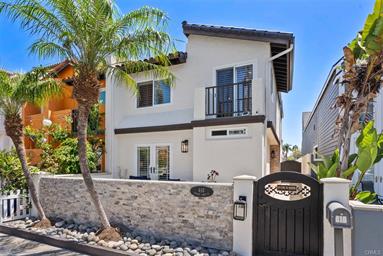
610 21st Street
Huntington Beach · 4 beds · 3 baths · 1,830 sq ft
CRMLS · OC26186684View photos & property details ↗
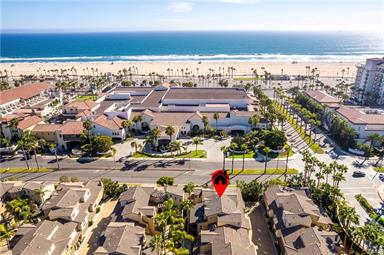
21336 Veleta CIR
Huntington Beach · 2 beds · 3 baths · 1,843 sq ft
CRMLS · OC26180822View photos & property details ↗
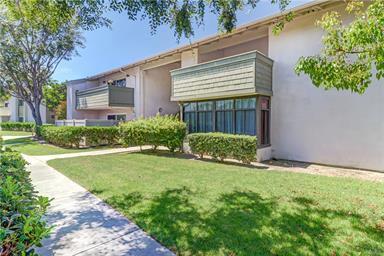
8633 Portola CT #17-E
Huntington Beach · 2 beds · 2 baths · 1,066 sq ft
CRMLS · OC26178393View photos & property details ↗
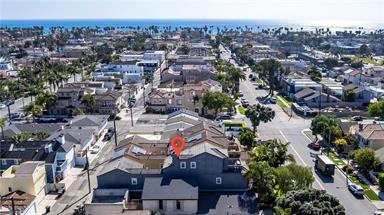
614 16th ST
Huntington Beach · 3 beds · 5 baths · 2,911 sq ft
CRMLS · OC26160334View photos & property details ↗
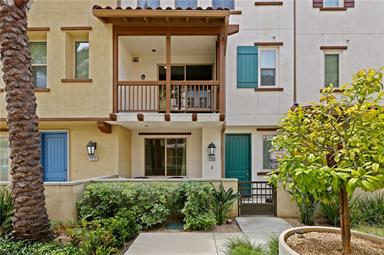
7269 Highwater
Huntington Beach · 4 beds · 4 baths · 1,946 sq ft
CRMLS · OC26159848View photos & property details ↗
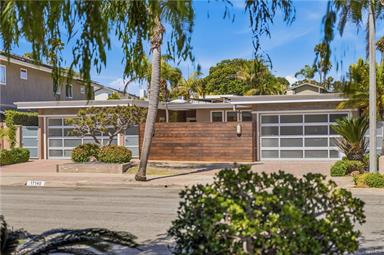
17140 Edgewater LN
Huntington Beach · 3 beds · 3 baths · 2,109 sq ft
CRMLS · OC26152341View photos & property details ↗
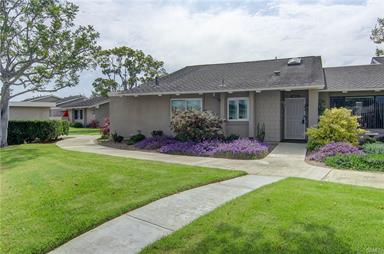
8566 Trinity CIR #816D
Huntington Beach · 3 beds · 2 baths · 1,487 sq ft
CRMLS · OC26148012View photos & property details ↗
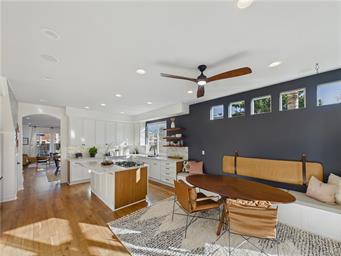
1201 Delaware ST
Huntington Beach · 4 beds · 4 baths · 2,977 sq ft
CRMLS · OC26020856View photos & property details ↗
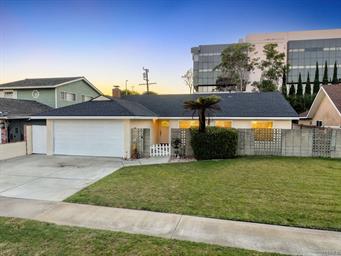
20431 Seven Seas LN
Huntington Beach · 3 beds · 2 baths · 1,311 sq ft
CRMLS · DW26167335View photos & property details ↗
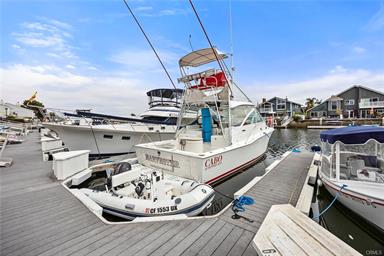
3742 Montego
Huntington Beach · 3 beds · 3 baths · 1,890 sq ft
CRMLS · PW26175493View photos & property details ↗
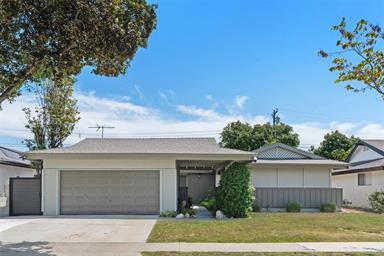
15842 Belfast
Huntington Beach · 4 beds · 2 baths · 1,630 sq ft
CRMLS · OC26176715View photos & property details ↗
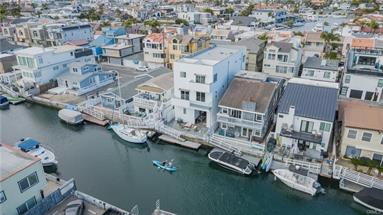
16785 Bayview DR
Huntington Beach · 4 beds · 4 baths · 3,099 sq ft
CRMLS · OC26109757View photos & property details ↗
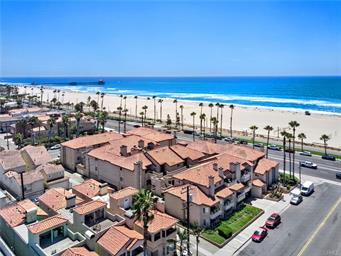
1400 Pacific Coast Hwy #103
Huntington Beach · 2 beds · 3 baths · 1,174 sq ft
CRMLS · PW26168988View photos & property details ↗
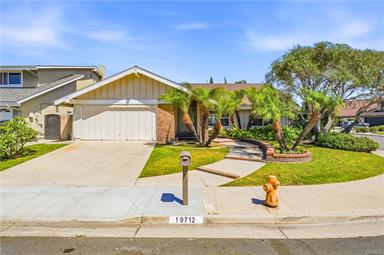
19712 Sacramento
Huntington Beach · 3 beds · 2 baths · 1,557 sq ft
CRMLS · OC26179602View photos & property details ↗
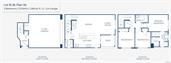
7268 Pointbreak DR
Huntington Beach · 3 beds · 3 baths · 1,389 sq ft
CRMLS · OC26177668View photos & property details ↗
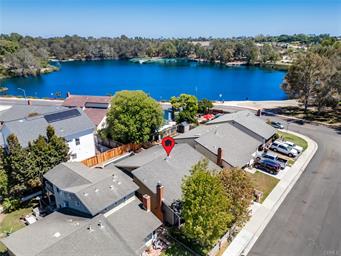
18092 Westlake Cir
Huntington Beach · 3 beds · 2 baths · 1,458 sq ft
CRMLS · OC26170286View photos & property details ↗
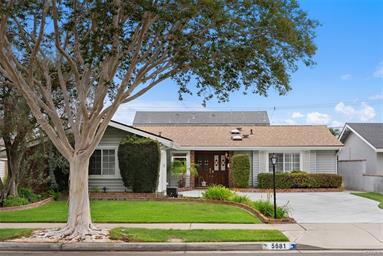
5681 Littler
Huntington Beach · 4 beds · 2 baths · 1,704 sq ft
CRMLS · OC26168520View photos & property details ↗
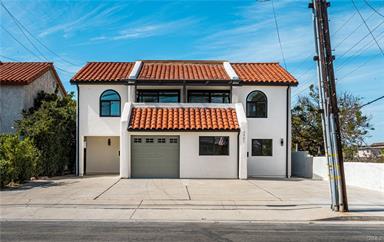
4981 Pearce
Huntington Beach · 7 beds · 6 baths · 3,098 sq ft
CRMLS · OC26167256View photos & property details ↗
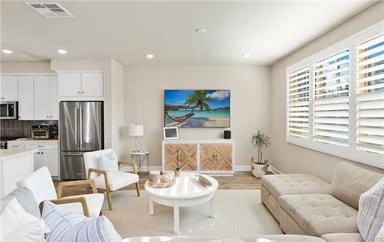
19239 Tideline CT
Huntington Beach · 4 beds · 3 baths · 1,912 sq ft
CRMLS · OC26127055View photos & property details ↗
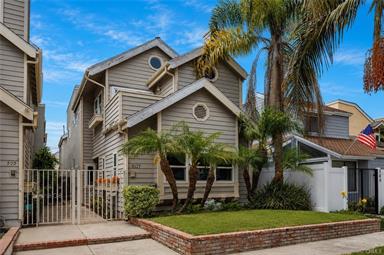
507 19th
Huntington Beach · 3 beds · 4 baths · 2,295 sq ft
CRMLS · OC26123905View photos & property details ↗
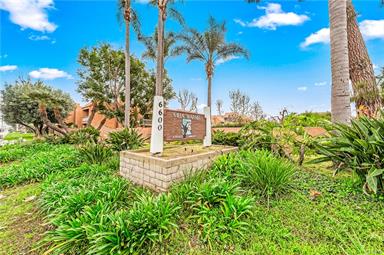
6600 Warner Ave #42
Huntington Beach · 1 beds · 1 baths · 785 sq ft
CRMLS · OC26109994View photos & property details ↗
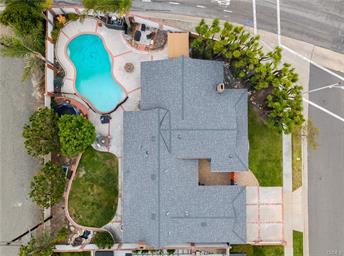
5471 Meadowlark DR
Huntington Beach · 4 beds · 3 baths · 2,234 sq ft
CRMLS · PV26124778View photos & property details ↗
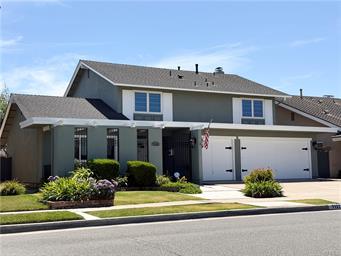
7132 Bluesails DR
Huntington Beach · 4 beds · 3 baths · 2,441 sq ft
CRMLS · OC26209444View photos & property details ↗
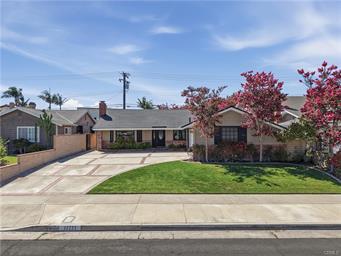
17771 Misty Lane
Huntington Beach · 3 beds · 2 baths · 1,774 sq ft
CRMLS · OC26196483View photos & property details ↗
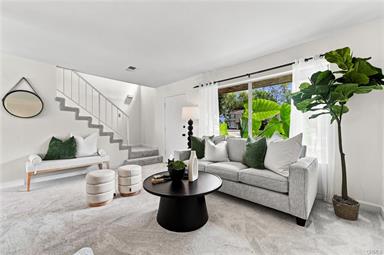
8437 El Arroyo
Huntington Beach · 3 beds · 2 baths · 1,048 sq ft
CRMLS · OC26182968View photos & property details ↗
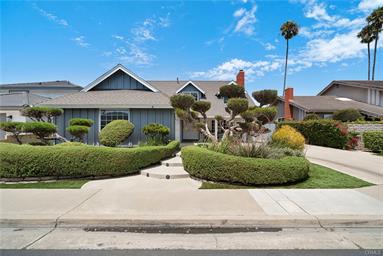
10101 Beverly DR
Huntington Beach · 5 beds · 3 baths · 2,622 sq ft
CRMLS · OC26169821View photos & property details ↗
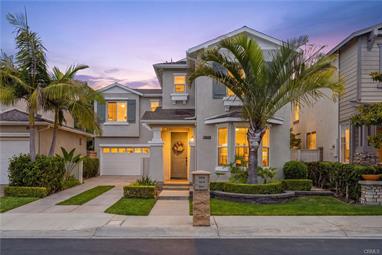
16836 Primrose LN
Huntington Beach · 2 beds · 3 baths · 1,641 sq ft
CRMLS · OC26163441View photos & property details ↗
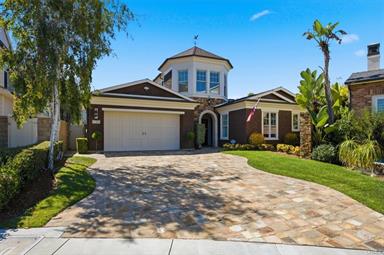
17351 Sagatuck LN
Huntington Beach · 4 beds · 4 baths · 3,682 sq ft
CRMLS · OC26151294View photos & property details ↗
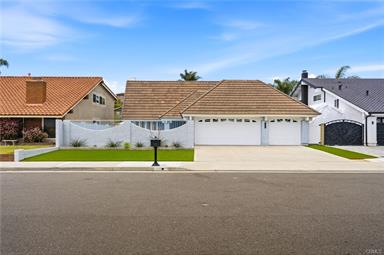
19151 Yacht LN
Huntington Beach · 4 beds · 3 baths · 2,538 sq ft
CRMLS · OC26123997View photos & property details ↗
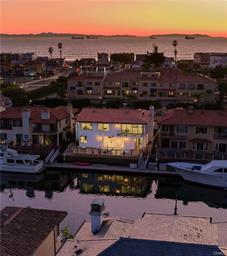
16572 Grimaud
Huntington Beach · 5 beds · 5 baths · 4,238 sq ft
CRMLS · OC26018183View photos & property details ↗
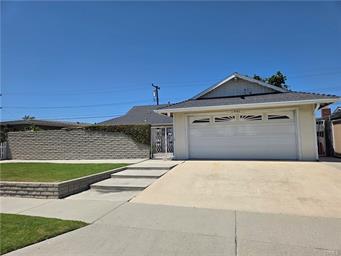
9141 Crawford
Huntington Beach · 4 beds · 2 baths · 1,446 sq ft
CRMLS · OC26208368View photos & property details ↗
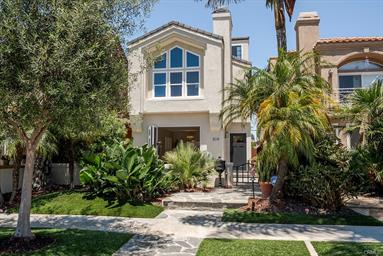
519 10th
Huntington Beach · 4 beds · 4 baths · 3,078 sq ft
CRMLS · OC26140382View photos & property details ↗
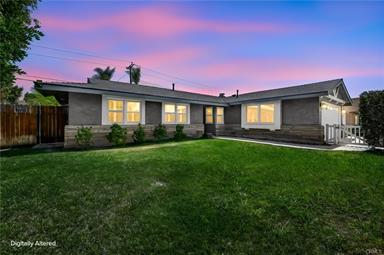
5972 Meadowlark DR
Huntington Beach · 3 beds · 2 baths · 1,268 sq ft
CRMLS · OC26138002View photos & property details ↗
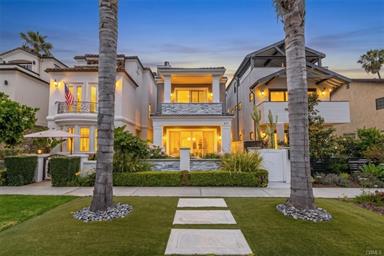
617 12th
Huntington Beach · 3 beds · 4 baths · 2,758 sq ft
CRMLS · OC26083548View photos & property details ↗
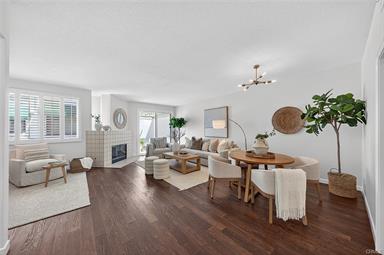
19462 Pompano LN #111
Huntington Beach · 3 beds · 4 baths · 1,989 sq ft
CRMLS · NP26119094View photos & property details ↗
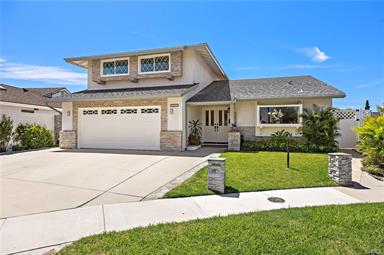
19581 Sanderson
Huntington Beach · 5 beds · 3 baths · 2,235 sq ft
CRMLS · PW26178874View photos & property details ↗
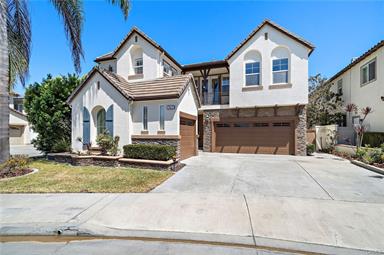
7405 Paloma DR
Huntington Beach · 5 beds · 5 baths · 3,193 sq ft
CRMLS · OC26181509View photos & property details ↗
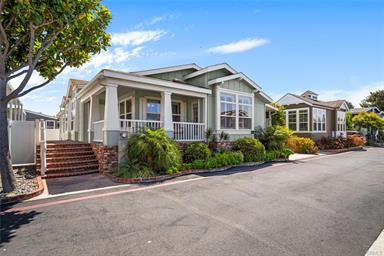
16422 Poipu Ln
Huntington Beach · 3 beds · 2 baths · 1,700 sq ft
CRMLS · OC26175573View photos & property details ↗
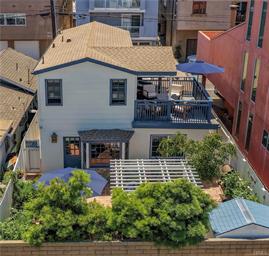
16742 Bayview
Huntington Beach · 2 beds · 2 baths · 1,180 sq ft
CRMLS · OC26125311View photos & property details ↗
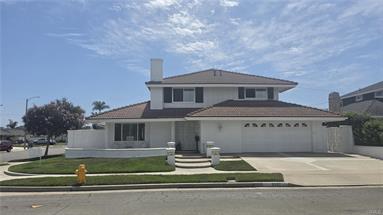
9092 Adelia CIR
Huntington Beach · 4 beds · 2 baths · 2,349 sq ft
CRMLS · OC26123928View photos & property details ↗
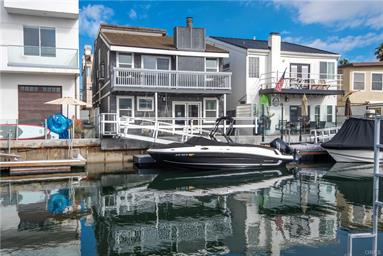
16791 Bayview DR
Huntington Beach · 3 beds · 3 baths · 2,618 sq ft
CRMLS · OC26011271View photos & property details ↗
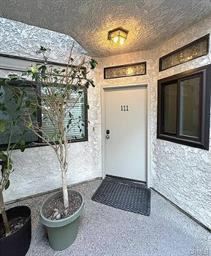
5031 Dorado #111
Huntington Beach · 2 beds · 2 baths · 1,002 sq ft
CRMLS · PW26206328View photos & property details ↗
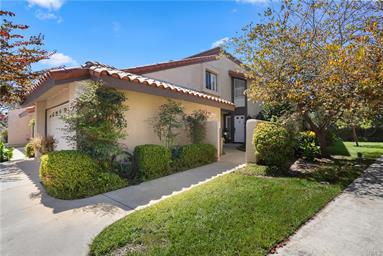
8272 Roma DR #35
Huntington Beach · 3 beds · 3 baths · 1,834 sq ft
CRMLS · OC26192791View photos & property details ↗
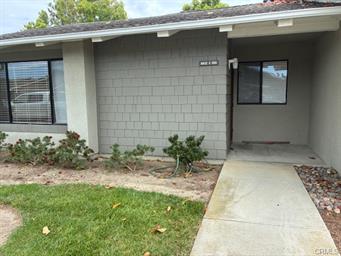
8932 Amador CIR #C1310
Huntington Beach · 2 beds · 2 baths · 1,091 sq ft
CRMLS · OC26160374View photos & property details ↗
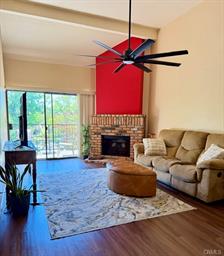
16951 Millpond Lane #51
Huntington Beach · 2 beds · 2 baths · 1,025 sq ft
CRMLS · OC26159572View photos & property details ↗
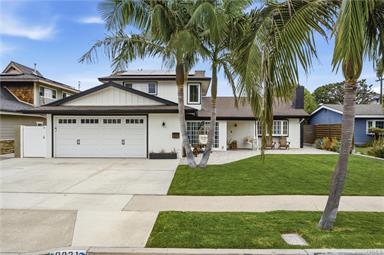
8021 Sunset CIR
Huntington Beach · 5 beds · 2 baths · 2,020 sq ft
CRMLS · OC26142189View photos & property details ↗
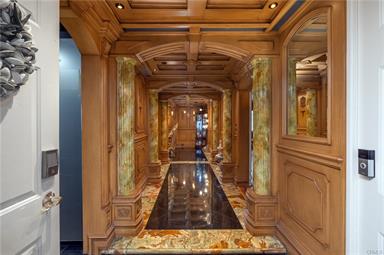
16255 Pacific CIR #203
Huntington Beach · 3 beds · 2 baths · 1,897 sq ft
CRMLS · OC26104704View photos & property details ↗
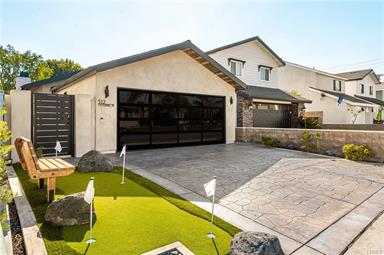
512 Oceanhill
Huntington Beach · 2 beds · 2 baths · 1,014 sq ft
CRMLS · NP26174703View photos & property details ↗
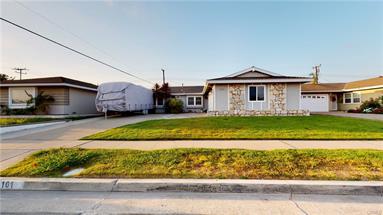
6101 Cornell
Huntington Beach · 4 beds · 3 baths · 1,519 sq ft
CRMLS · PW26156919View photos & property details ↗
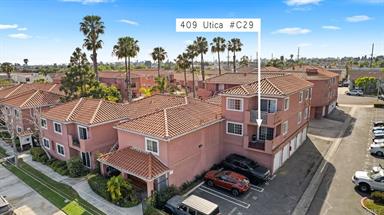
409 Utica #C-29
Huntington Beach · 3 beds · 2 baths · 1,166 sq ft
CRMLS · PW26071192View photos & property details ↗
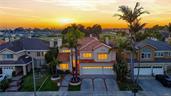
21171 Hillsdale LN
Huntington Beach · 4 beds · 5 baths · 3,938 sq ft
CRMLS · OC26176681View photos & property details ↗
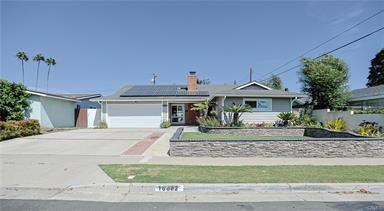
16682 Charles
Huntington Beach · 4 beds · 2 baths · 1,448 sq ft
CRMLS · OC26173338View photos & property details ↗
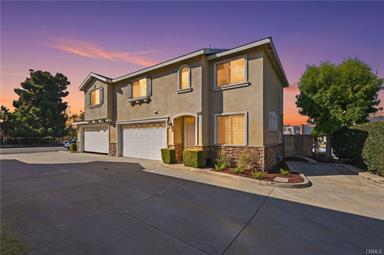
2724 17th ST
Huntington Beach · 3 beds · 3 baths · 1,847 sq ft
CRMLS · OC26168357View photos & property details ↗
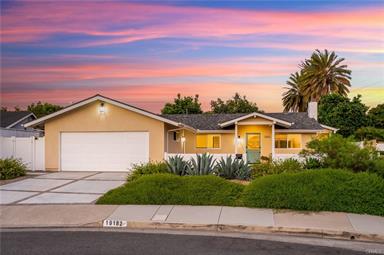
19182 Lindsay LN
Huntington Beach · 4 beds · 4 baths · 1,754 sq ft
CRMLS · OC26166323View photos & property details ↗
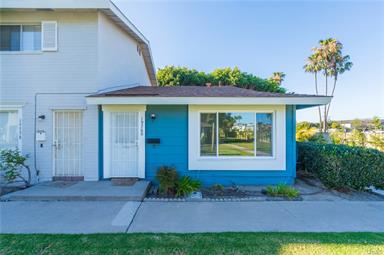
19760 Kingswood
Huntington Beach · 1 beds · 1 baths · 600 sq ft
CRMLS · OC26142017View photos & property details ↗
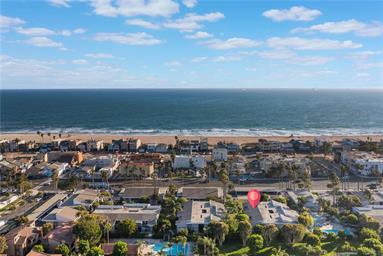
16922 Pacific Coast Hwy #102
Huntington Beach · 1 beds · 1 baths · 546 sq ft
CRMLS · OC26136030View photos & property details ↗
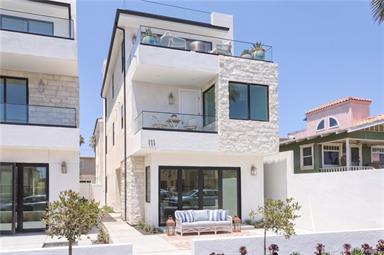
111 9th
Huntington Beach · 4 beds · 5 baths · 2,873 sq ft
CRMLS · OC26128810View photos & property details ↗
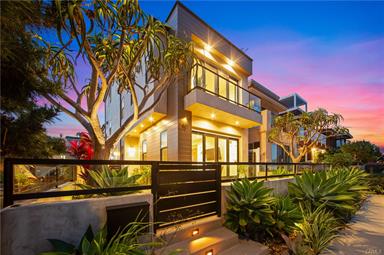
621 Frankfort AVE
Huntington Beach · 4 beds · 4 baths · 3,087 sq ft
CRMLS · OC26127607View photos & property details ↗
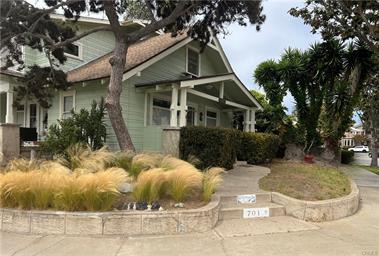
701 10th
Huntington Beach · 5 beds · 2 baths · 2,004 sq ft
CRMLS · OC26122007View photos & property details ↗
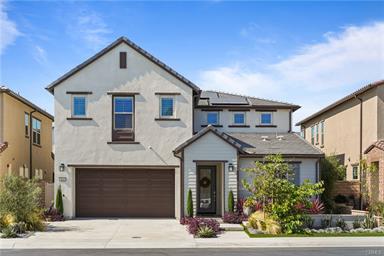
9611 Gisler DR
Huntington Beach · 4 beds · 4 baths · 3,003 sq ft
CRMLS · OC26169256View photos & property details ↗
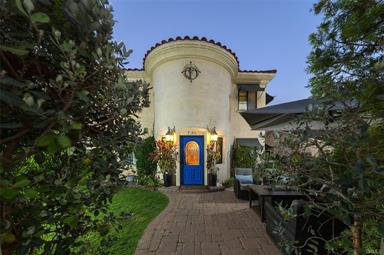
736 14th
Huntington Beach · 5 beds · 4 baths · 3,100 sq ft
CRMLS · OC26169183View photos & property details ↗
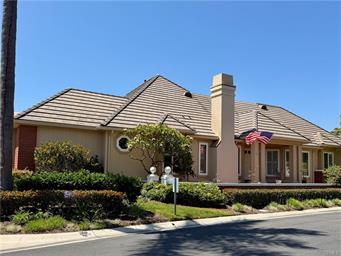
6141 Eaglecrest
Huntington Beach · 3 beds · 3 baths · 2,437 sq ft
CRMLS · OC26131853View photos & property details ↗
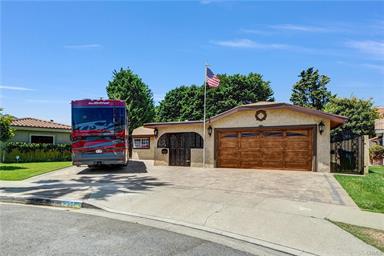
607 Jana CIR
Huntington Beach · 4 beds · 2 baths · 1,842 sq ft
CRMLS · MB26169449View photos & property details ↗
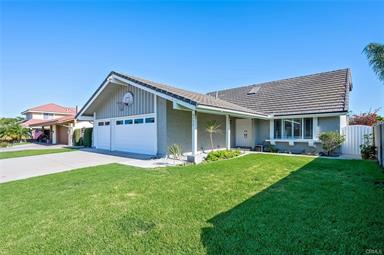
9532 Caithness
Huntington Beach · 4 beds · 3 baths · 2,367 sq ft
CRMLS · SR26171563View photos & property details ↗
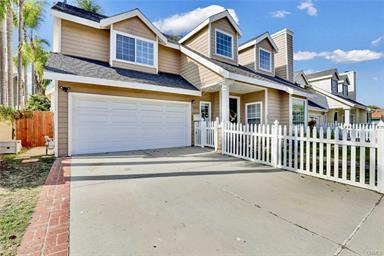
1813 Huntington ST
Huntington Beach · 4 beds · 4 baths · 2,123 sq ft
CRMLS · PW26073062View photos & property details ↗
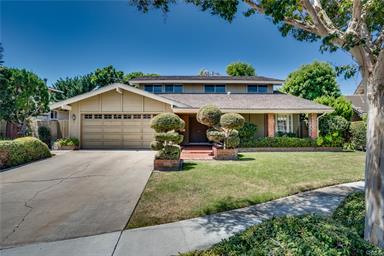
17331 Elsinore
Huntington Beach · 5 beds · 3 baths · 2,276 sq ft
CRMLS · OC26170686View photos & property details ↗
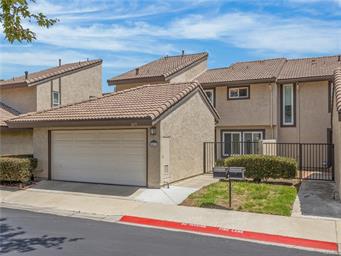
8471 Basin CIR
Huntington Beach · 4 beds · 3 baths · 1,734 sq ft
CRMLS · OC26118133View photos & property details ↗
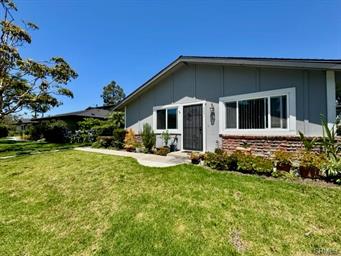
16651 Arbor
Huntington Beach · 2 beds · 1 baths · 758 sq ft
CRMLS · OC26111924View photos & property details ↗
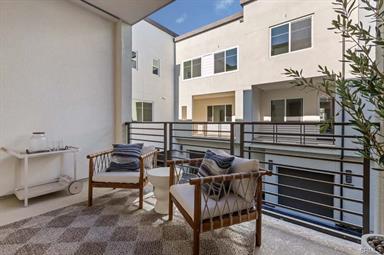
7255 Aura CIR
Huntington Beach · 2 beds · 3 baths · 1,266 sq ft
CRMLS · OC26100011View photos & property details ↗
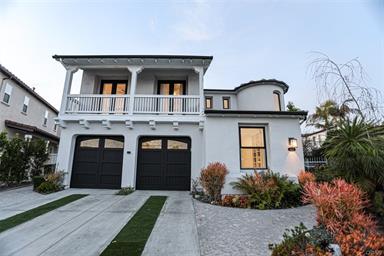
6525 Fremont
Huntington Beach · 4 beds · 3 baths · 3,413 sq ft
CRMLS · OC26016566View photos & property details ↗
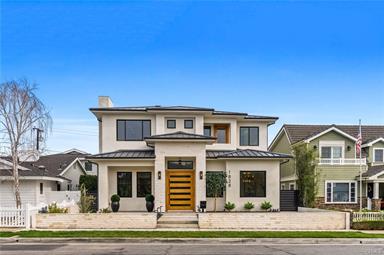
1828 Pine ST
Huntington Beach · 4 beds · 6 baths · 4,200 sq ft
CRMLS · OC26014001View photos & property details ↗
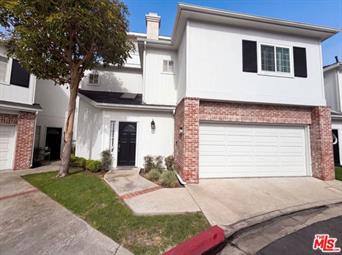
18743 Chapel LN
Huntington Beach · 3 beds · 3 baths · 1,577 sq ft
CRMLS · 26868177View photos & property details ↗
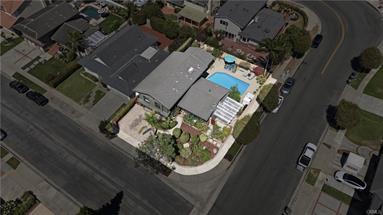
17432 Almelo LN
Huntington Beach · 4 beds · 3 baths · 2,469 sq ft
CRMLS · PW26152973View photos & property details ↗
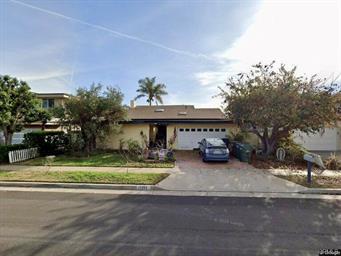
17051 Westport
Huntington Beach · 4 beds · 2 baths · 3,254 sq ft
CRMLS · OC26184676View photos & property details ↗
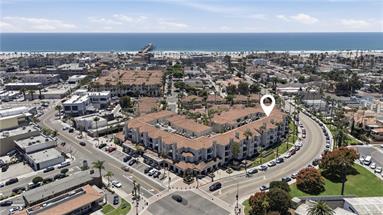
415 Townsquare LN
Huntington Beach · 2 beds · 2 baths · 1,038 sq ft
CRMLS · OC26182585View photos & property details ↗
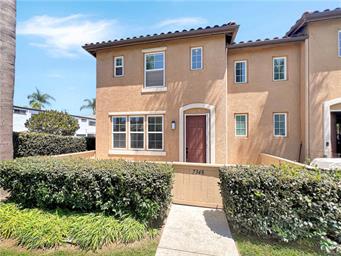
7348 Berry CT
Huntington Beach · 2 beds · 3 baths · 1,148 sq ft
CRMLS · OC26172674View photos & property details ↗
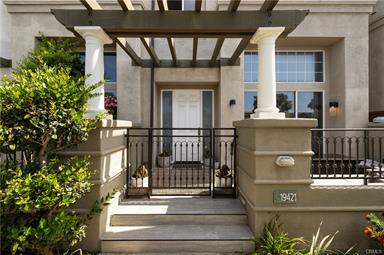
19421 Surfset DR
Huntington Beach · 3 beds · 3 baths · 2,140 sq ft
CRMLS · OC26170995View photos & property details ↗
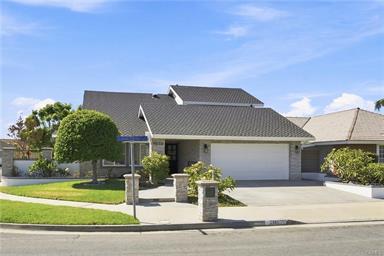
21891 Summerwind
Huntington Beach · 5 beds · 3 baths · 2,420 sq ft
CRMLS · OC26169717View photos & property details ↗
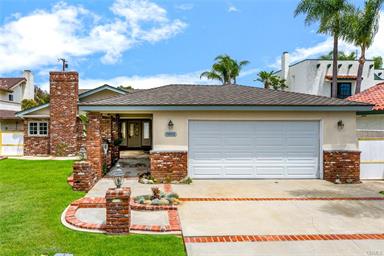
18922 Gregory LN
Huntington Beach · 4 beds · 2 baths · 2,434 sq ft
CRMLS · OC26159779View photos & property details ↗
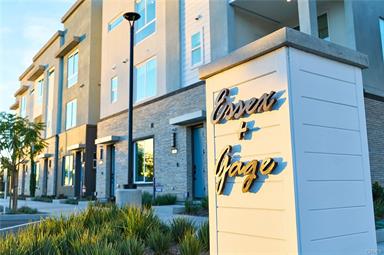
7248 Pointbreak DR
Huntington Beach · 4 beds · 4 baths · 1,645 sq ft
CRMLS · OC26132653View photos & property details ↗
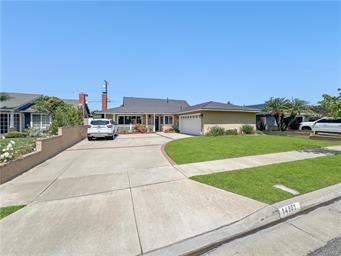
14901 Quill Circle
Huntington Beach · 4 beds · 2 baths · 1,438 sq ft
CRMLS · OC26127979View photos & property details ↗
215 Wichita AVE #409
Huntington Beach · 3 beds · 2 baths · 1,291 sq ft
CRMLS · OC26117178View photos & property details ↗
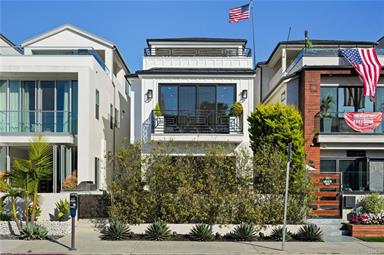
306 3rd ST
Huntington Beach · 3 beds · 5 baths · 3,080 sq ft
CRMLS · OC26108921View photos & property details ↗
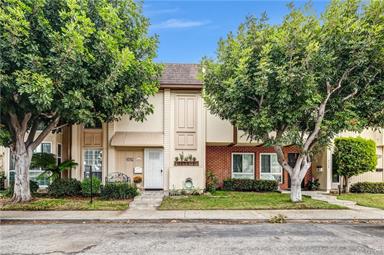
9742 Villa Pacific
Huntington Beach · 2 beds · 3 baths · 1,462 sq ft
CRMLS · OC26099375View photos & property details ↗
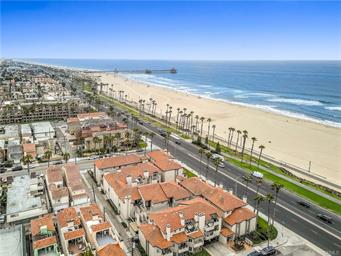
1400 Pacific Coast #305
Huntington Beach · 2 beds · 2 baths · 1,021 sq ft
CRMLS · OC26087108View photos & property details ↗
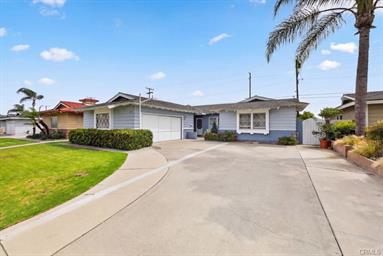
6082 Medford
Huntington Beach · 5 beds · 2 baths · 1,649 sq ft
CRMLS · OC26083544View photos & property details ↗
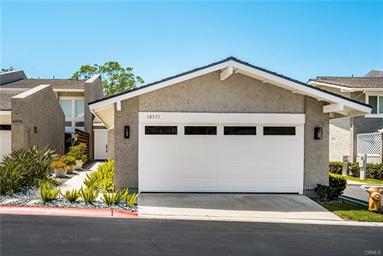
18571 Vallarta Drive
Huntington Beach · 2 beds · 2 baths · 1,149 sq ft
CRMLS · PW26165453View photos & property details ↗
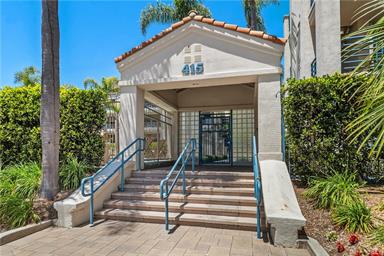
415 Townsquare LN #308
Huntington Beach · 1 beds · 1 baths · 838 sq ft
CRMLS · PW26152450View photos & property details ↗
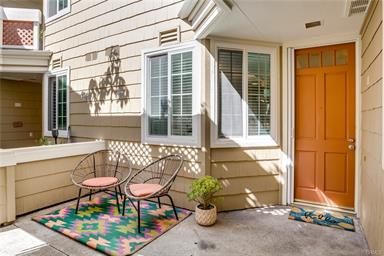
7321 Coho #103
Huntington Beach · 2 beds · 2 baths · 1,164 sq ft
CRMLS · OC26176252View photos & property details ↗
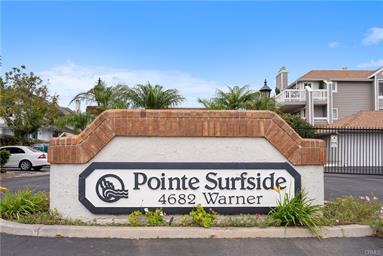
4682 Warner #C-113
Huntington Beach · 2 beds · 1 baths · 939 sq ft
CRMLS · OC26166816View photos & property details ↗
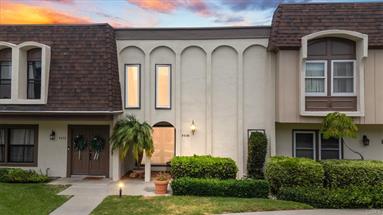
9696 Monte Carlo
Huntington Beach · 3 beds · 2 baths · 1,217 sq ft
CRMLS · OC26157637View photos & property details ↗
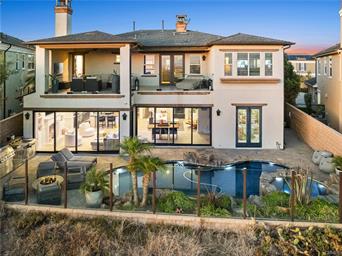
4682 Oceanridge
Huntington Beach · 4 beds · 6 baths · 4,416 sq ft
CRMLS · OC26099744View photos & property details ↗
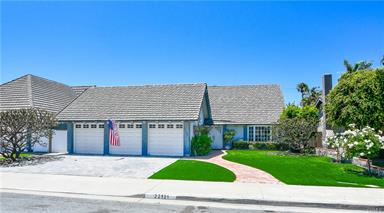
22131 Wood Island
Huntington Beach · 4 beds · 3 baths · 2,370 sq ft
CRMLS · NP26177037View photos & property details ↗
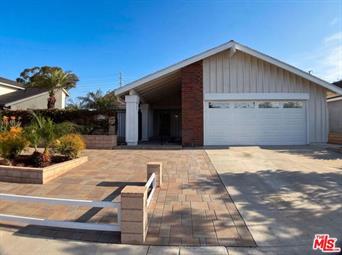
8361 Northport DR
Huntington Beach · 3 beds · 2 baths · 1,406 sq ft
CRMLS · 26873327View photos & property details ↗
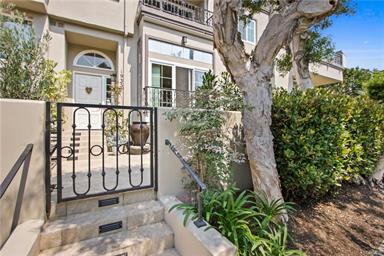
19355 Maidstone
Huntington Beach · 3 beds · 3 baths · 2,065 sq ft
CRMLS · RS26071460View photos & property details ↗
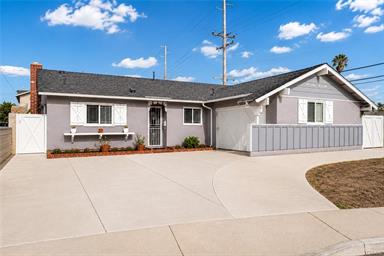
17472 Waal Circle
Huntington Beach · 4 beds · 2 baths · 1,279 sq ft
CRMLS · PW26148157View photos & property details ↗
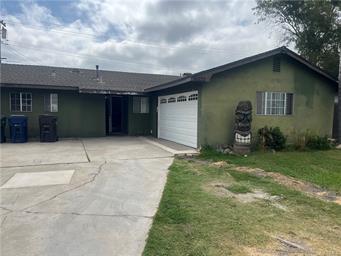
16232 Nassau
Huntington Beach · 3 beds · 2 baths · 1,122 sq ft
CRMLS · OC26198489View photos & property details ↗
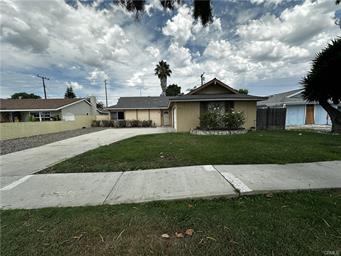
5751 Castle DR
Huntington Beach · 3 beds · 2 baths · 1,639 sq ft
CRMLS · OC26188825View photos & property details ↗
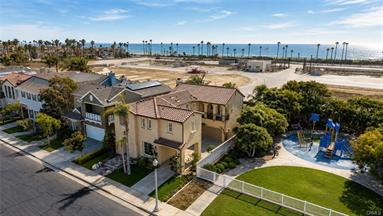
6572 Beachview DR
Huntington Beach · 3 beds · 3 baths · 2,578 sq ft
CRMLS · OC26181960View photos & property details ↗
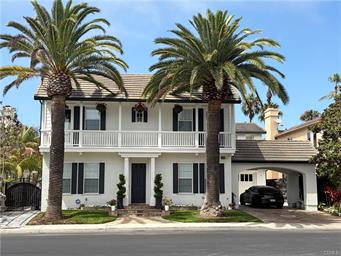
6651 Silent Harbor
Huntington Beach · 5 beds · 5 baths · 4,517 sq ft
CRMLS · OC26175599View photos & property details ↗
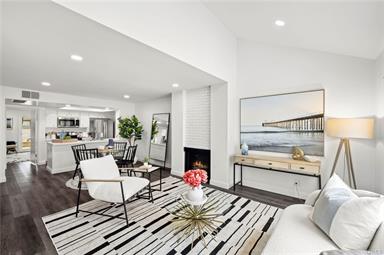
18683 Maplewood
Huntington Beach · 3 beds · 2 baths · 1,360 sq ft
CRMLS · OC26134716View photos & property details ↗
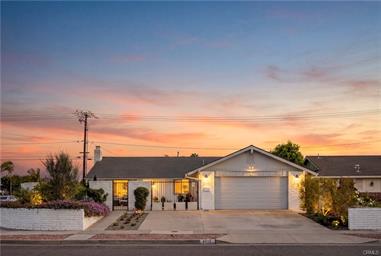
6302 Vatcher
Huntington Beach · 3 beds · 2 baths · 1,176 sq ft
CRMLS · OC26134697View photos & property details ↗
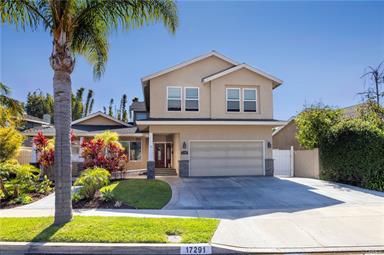
17291 Forbes
Huntington Beach · 7 beds · 5 baths · 3,203 sq ft
CRMLS · OC26105096View photos & property details ↗
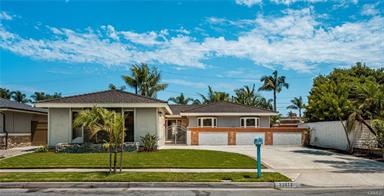
22072 Surfrider Lane
Huntington Beach · 3 beds · 2 baths · 1,804 sq ft
CRMLS · NP26162036View photos & property details ↗
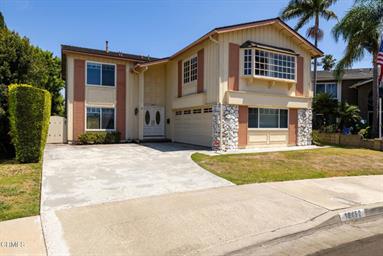
16452 Whittier LN
Huntington Beach · 4 beds · 3 baths · 2,432 sq ft
CRMLS · P1-28443View photos & property details ↗
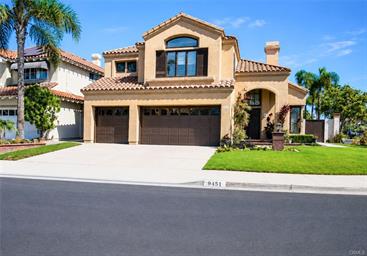
9451 Lawton DR
Huntington Beach · 4 beds · 3 baths · 3,388 sq ft
CRMLS · OC26198751View photos & property details ↗
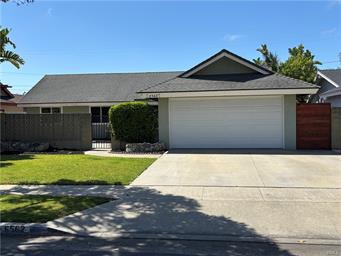
6562 Corrine
Huntington Beach · 4 beds · 2 baths · 1,277 sq ft
CRMLS · OC26173894View photos & property details ↗
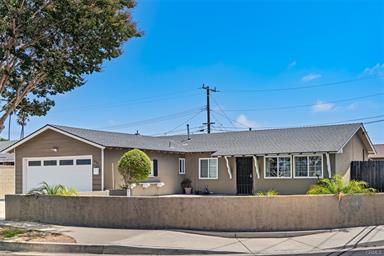
6502 Edgemont
Huntington Beach · 4 beds · 2 baths · 1,368 sq ft
CRMLS · OC26168479View photos & property details ↗
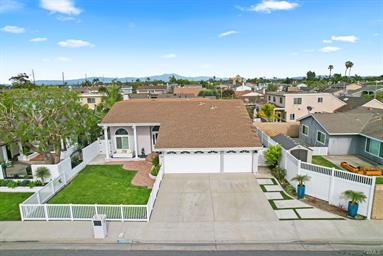
20082 Mayport LN
Huntington Beach · 4 beds · 3 baths · 2,413 sq ft
CRMLS · OC26086177View photos & property details ↗
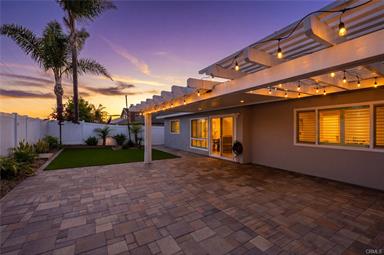
9952 Effingham
Huntington Beach · 3 beds · 2 baths · 1,602 sq ft
CRMLS · TR26168863View photos & property details ↗
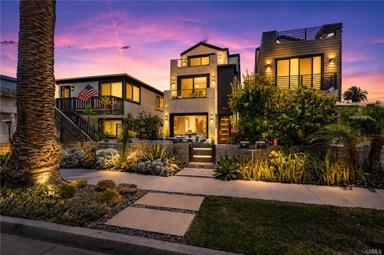
404 10th ST
Huntington Beach · 3 beds · 4 baths · 2,884 sq ft
CRMLS · PW26131014View photos & property details ↗
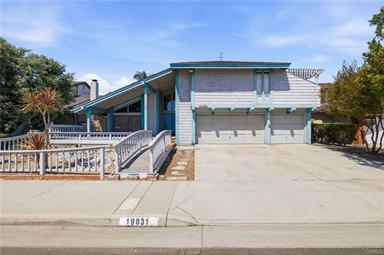
19831 Flagstone
Huntington Beach · 4 beds · 3 baths · 2,084 sq ft
CRMLS · PW26109574View photos & property details ↗
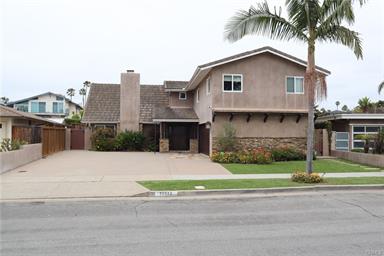
17132 17132 Edgewater Lane
Huntington Beach · 4 beds · 4 baths · 3,265 sq ft
CRMLS · PW26104254View photos & property details ↗
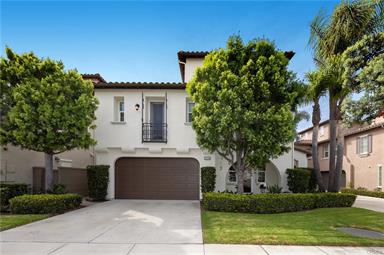
18741 Sinclair LN
Huntington Beach · 4 beds · 4 baths · 2,576 sq ft
CRMLS · OC26176238View photos & property details ↗
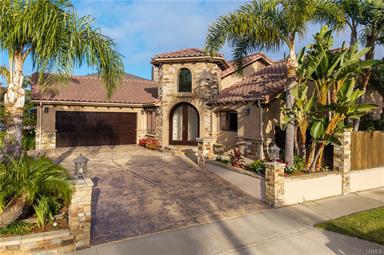
9112 Regatta
Huntington Beach · 3 beds · 3 baths · 2,215 sq ft
CRMLS · OC26158169View photos & property details ↗
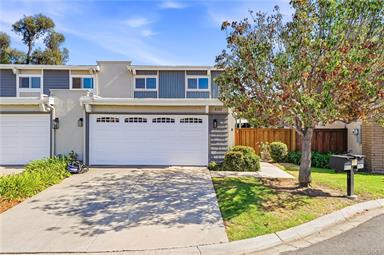
8322 Padrino
Huntington Beach · 4 beds · 3 baths · 1,898 sq ft
CRMLS · OC26140288View photos & property details ↗
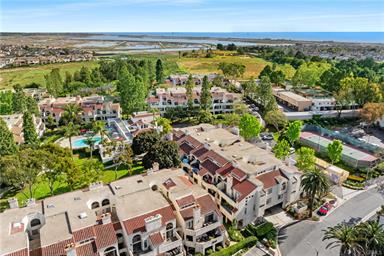
17172 Abalone #211
Huntington Beach · 2 beds · 2 baths · 1,178 sq ft
CRMLS · OC26083649View photos & property details ↗
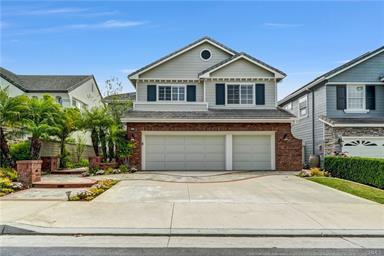
6292 Forester
Huntington Beach · 4 beds · 4 baths · 3,150 sq ft
CRMLS · OC26070218View photos & property details ↗
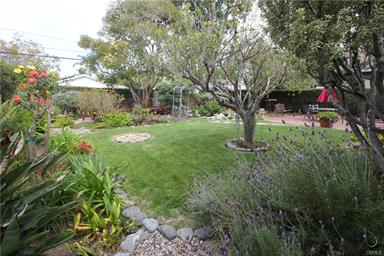
1729 Lake
Huntington Beach · 3 beds · 1 baths · 997 sq ft
CRMLS · DW26158815View photos & property details ↗
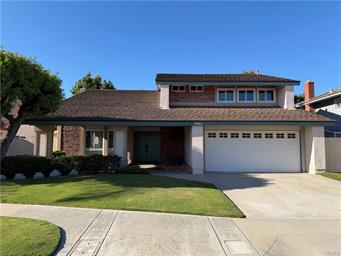
9961 Oceancrest DR
Huntington Beach · 4 beds · 3 baths · 2,342 sq ft
CRMLS · OC26194755View photos & property details ↗
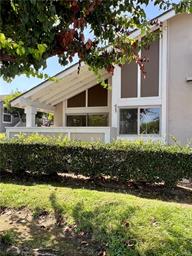
6712 Sun DR #A
Huntington Beach · 2 beds · 1 baths · 878 sq ft
CRMLS · PW26175635View photos & property details ↗
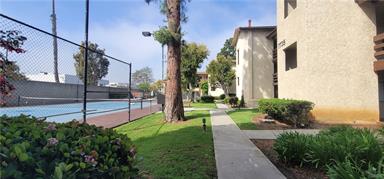
7735 Newman AVE #104
Huntington Beach · 2 beds · 2 baths · 1,226 sq ft
CRMLS · PW26151075View photos & property details ↗
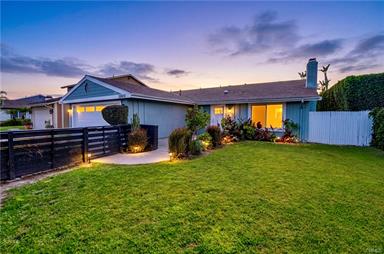
20911 Charwood
Huntington Beach · 3 beds · 2 baths · 1,863 sq ft
CRMLS · OC26166620View photos & property details ↗
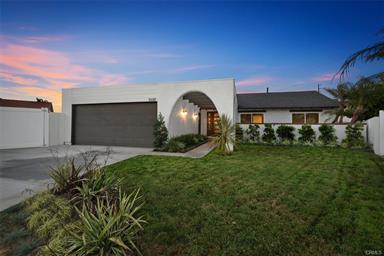
10081 Spar
Huntington Beach · 4 beds · 2 baths · 1,703 sq ft
CRMLS · OC26132491View photos & property details ↗
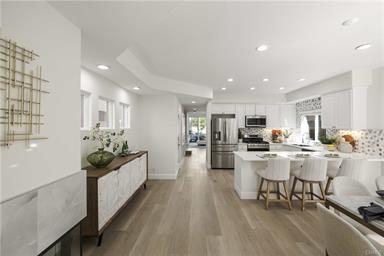
526 12th St
Huntington Beach · 4 beds · 4 baths · 2,776 sq ft
CRMLS · OC26091886View photos & property details ↗
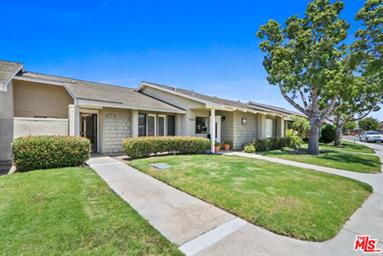
8645 Butte
Huntington Beach · 2 beds · 2 baths · 1,072 sq ft
CRMLS · 26851555View photos & property details ↗
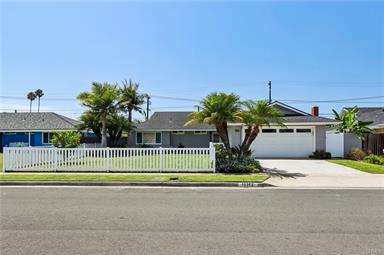
10362 Christmas DR
Huntington Beach · 4 beds · 2 baths · 1,489 sq ft
CRMLS · SB26155801View photos & property details ↗
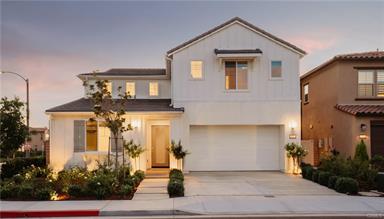
21171 Strathmoor
Huntington Beach · 4 beds · 4 baths · 3,003 sq ft
CRMLS · PW26164310View photos & property details ↗
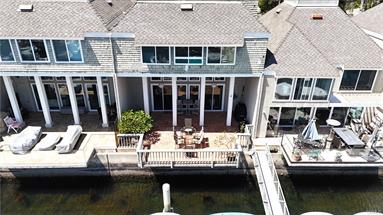
16451 Wimbledon
Huntington Beach · 3 beds · 3 baths · 2,120 sq ft
CRMLS · PW26114214View photos & property details ↗
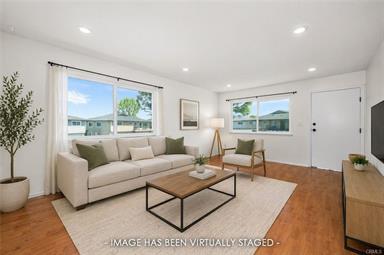
7837 Arbor CIR #96D
Huntington Beach · 2 beds · 1 baths · 799 sq ft
CRMLS · PW26088737View photos & property details ↗
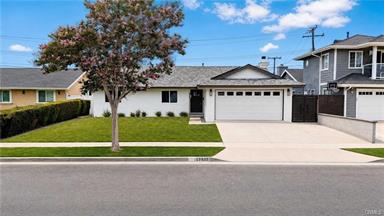
19611 Trident
Huntington Beach · 4 beds · 3 baths · 1,782 sq ft
CRMLS · OC26188799View photos & property details ↗
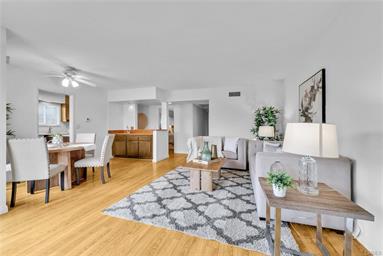
9766 Verde Mar DR
Huntington Beach · 2 beds · 2 baths · 1,103 sq ft
CRMLS · OC26152907View photos & property details ↗
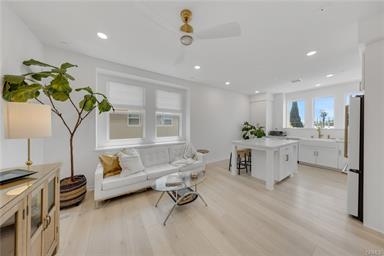
17961 Conch LN
Huntington Beach · 3 beds · 3 baths · 1,283 sq ft
CRMLS · NP26112308View photos & property details ↗
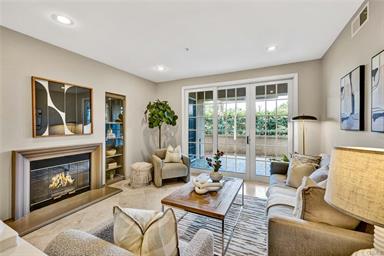
5142 Warner AVE #109
Huntington Beach · 2 beds · 2 baths · 1,342 sq ft
CRMLS · PW26101068View photos & property details ↗
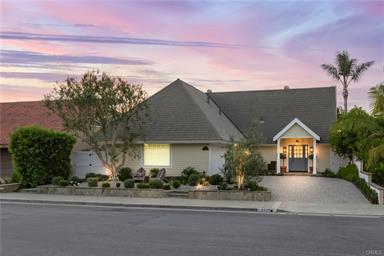
9601 Dumbreck DR
Huntington Beach · 4 beds · 3 baths · 2,590 sq ft
CRMLS · OC26157176View photos & property details ↗
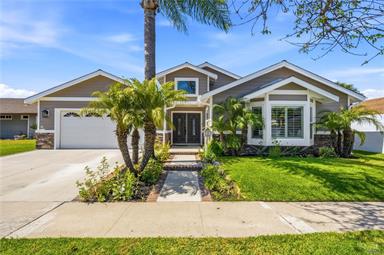
10151 Bismark
Huntington Beach · 4 beds · 3 baths · 2,200 sq ft
CRMLS · OC26138845View photos & property details ↗
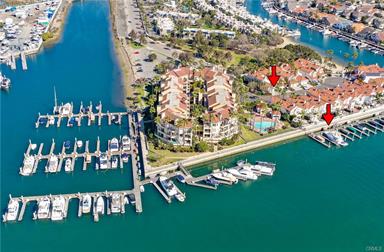
3161 Portofino
Huntington Beach · 3 beds · 3 baths · 2,814 sq ft
CRMLS · OC26092365View photos & property details ↗
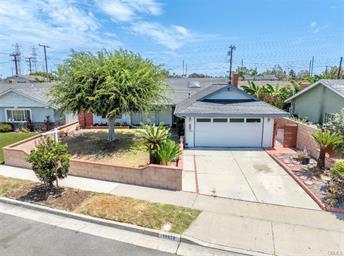
19532 Independence Lane
Huntington Beach · 3 beds · 2 baths · 1,626 sq ft
CRMLS · PW26172147View photos & property details ↗
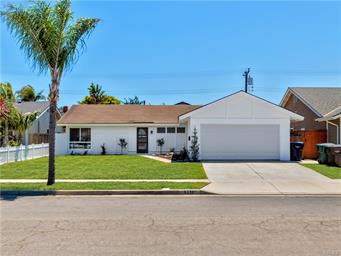
9312 Nautilus
Huntington Beach · 2 beds · 1 baths · 894 sq ft
CRMLS · PW26165104View photos & property details ↗
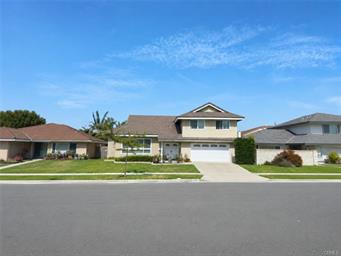
20061 Beaumont
Huntington Beach · 3 beds · 3 baths · 2,261 sq ft
CRMLS · OC26191544View photos & property details ↗
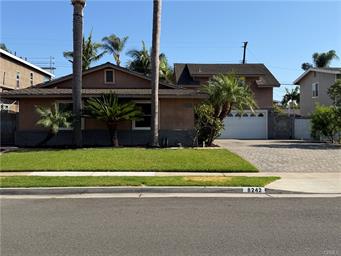
8242 Lambert DR
Huntington Beach · 4 beds · 3 baths · 1,728 sq ft
CRMLS · OC26172645View photos & property details ↗
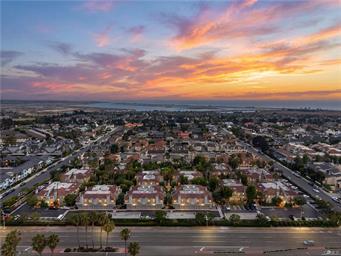
4802 Tiara #204
Huntington Beach · 1 beds · 1 baths · 730 sq ft
CRMLS · OC26159197View photos & property details ↗
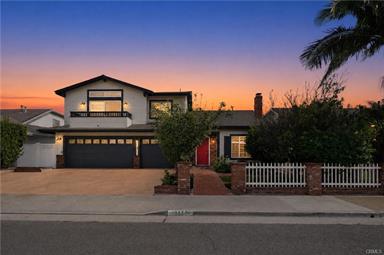
9072 Colbreggan Dr.
Huntington Beach · 5 beds · 4 baths · 3,007 sq ft
CRMLS · OC26115711View photos & property details ↗
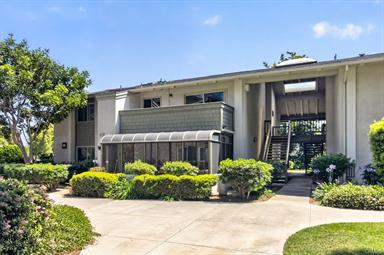
8633 Portola CT #18F
Huntington Beach · 2 beds · 2 baths · 1,032 sq ft
CRMLS · OC26103755View photos & property details ↗
Source: CRMLS Matrix, closed September 1–30, 2026; Single Family Residence, Condominium, and Townhouse. This is a separate dataset from RPR. Photos are from the listing record. Model photos, floor plans, and edited images are labelled when identified. Open OneHome for full property details.
Around Huntington Beach
Local news and developments.
February 6, 2026 review notice
Palm and Goldenwest proposal enters environmental review
A proposed specific-plan amendment covers about 92 acres near Palm and Goldenwest. The review describes up to 800 homes, 350 hotel rooms, and public open space. These are proposed uses under environmental review, not an announcement that construction has been approved.
Read the local update ↗June 2026 state project update
Abandoned well work completed near the coast
CalGEM reports that plugging at 320 21st Street was completed June 10, followed by final restoration June 17. The work addresses an abandoned oil well near existing homes and the beach. It is a completed maintenance and environmental project.
Read the local update ↗Local updates checked October 22, 2026. Each item shows its original action date or planning context.
From city trends to your home
Want a closer look at your home’s value?
I will look at the nearby sales, competing listings, and details that make your property different. You will get a clearer starting point for your next decision.
No pressure to list. Just a useful conversation.Prefer to talk? (949) 534-6686
Sources, methodology, and data notes
Headline statistics and charts: RPR Market Trends for Huntington Beach, September 2026, Single Family. RPR public-record sales are not combined with listing sales. Recent properties: CRMLS, closed September 1–30, 2026, Single Family Residence, Condominium, and Townhouse. Listing-city labels do not certify municipal boundaries. A city median does not establish a particular home’s value.
Explore other local market reports · Request a personal home-value review